29
/
en
AIzaSyAYiBZKx7MnpbEhh9jyipgxe19OcubqV5w
April 1, 2024
247529
Spain
ESP
true
2
1
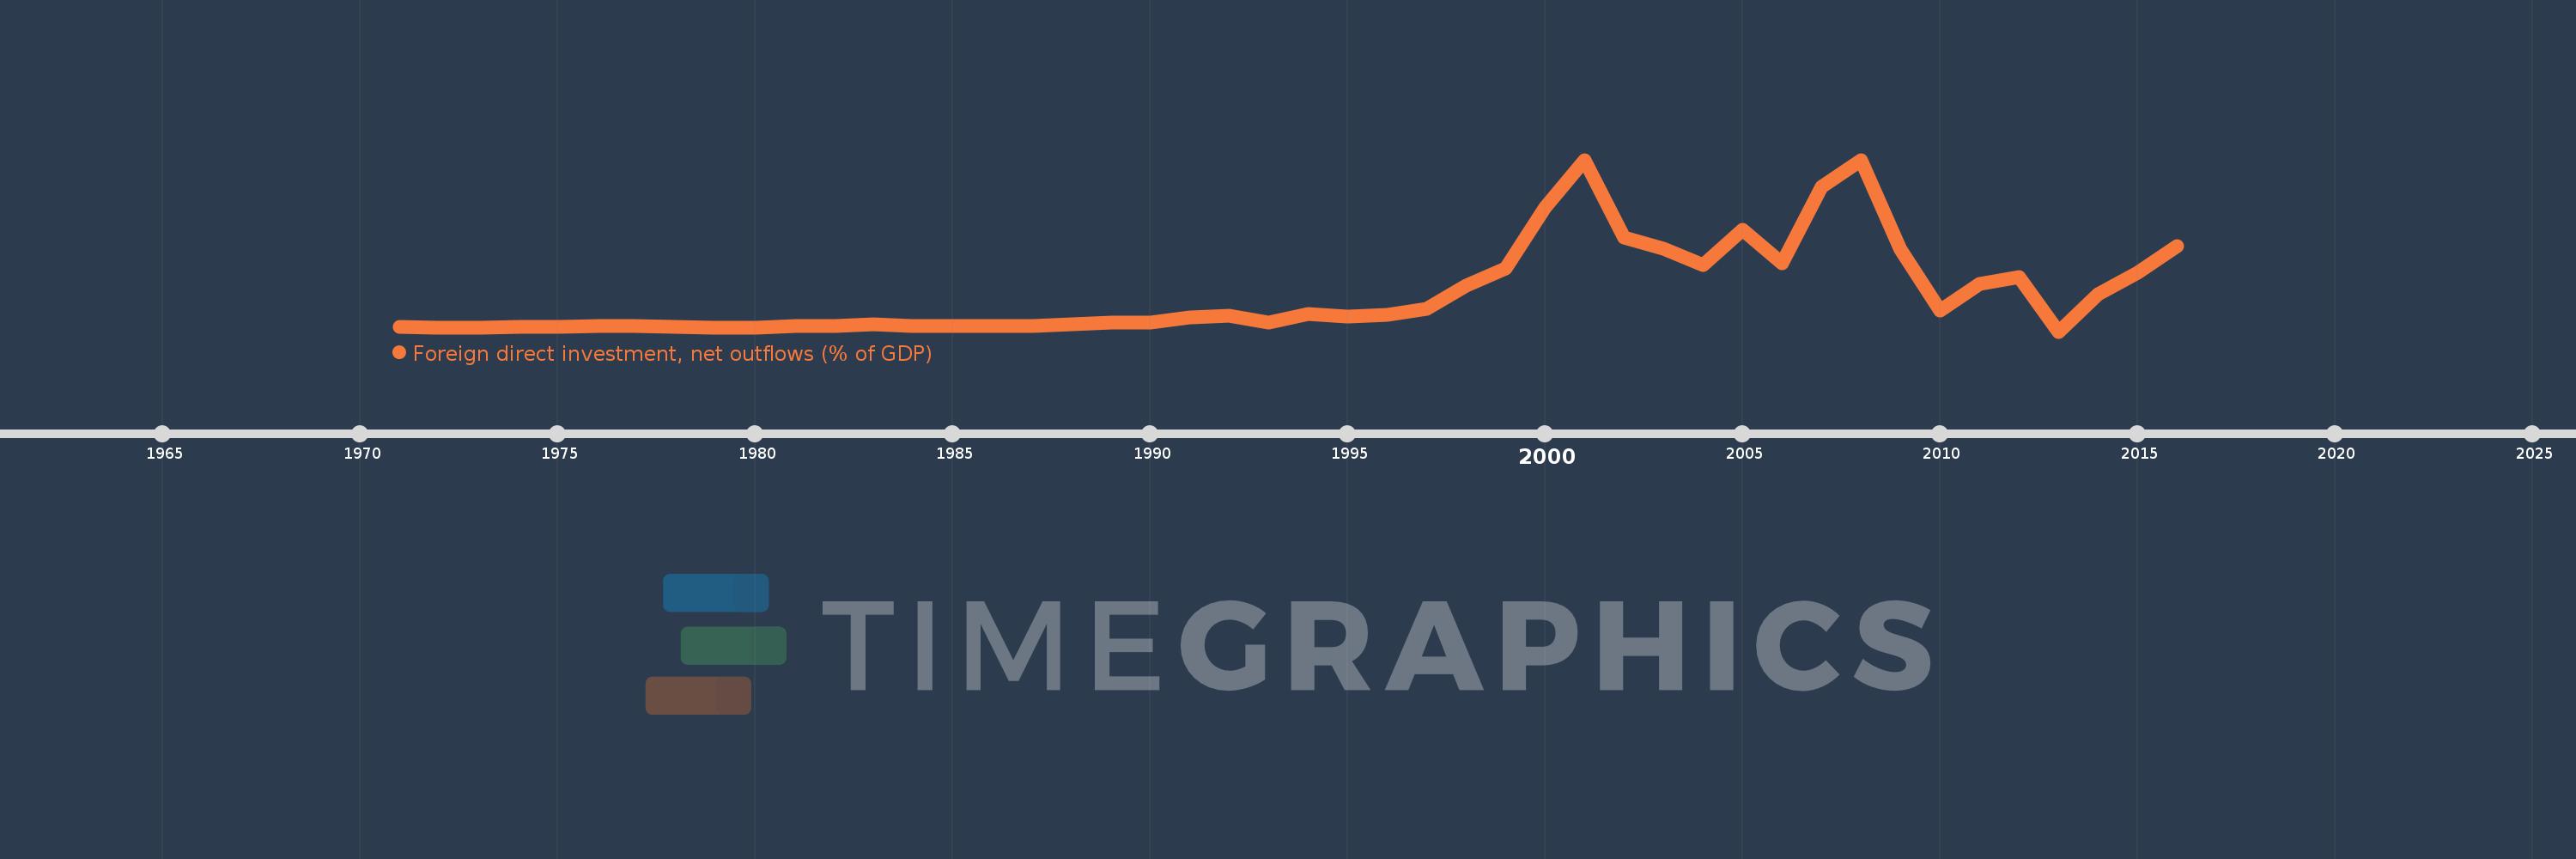
Foreign direct investment, net outflows (% of GDP)
2016,2015,2014,2013,2012,2011,2010,2009,2008,2007,2006,2005,2004,2003,2002,2001,2000,1999,1998,1997,1996,1995,1994,1993,1992,1991,1990,1989,1988,1987,1986,1985,1984,1983,1982,1981,1980,1979,1978,1977,1976,1975,1974,1973,1972,1971
This statistics in other country:
AfghanistanAlbaniaAlgeriaAngolaAntigua and BarbudaArab WorldArgentinaArmeniaArubaAustraliaAustriaAzerbaijanBahamas, TheBahrainBangladeshBarbadosBelarusBelgiumBelizeBeninBermudaBoliviaBosnia and HerzegovinaBotswanaBrazilBrunei DarussalamBulgariaBurkina FasoBurundiCabo VerdeCambodiaCameroonCanadaCaribbean small statesCayman IslandsCentral African RepublicCentral Europe and the BalticsChadChileChinaColombiaComorosCongo, Dem. Rep.Congo, Rep.Costa RicaCote d'IvoireCroatiaCyprusCzech RepublicDenmarkDominicaDominican RepublicEarly-demographic dividendEast Asia & PacificEast Asia & Pacific (excluding high income)East Asia & Pacific (IDA & IBRD countries)EcuadorEgypt, Arab Rep.El SalvadorEquatorial GuineaEritreaEstoniaEuro areaEurope & Central AsiaEurope & Central Asia (excluding high income)Europe & Central Asia (IDA & IBRD countries)European UnionFijiFinlandFragile and conflict affected situationsFranceFrench PolynesiaGabonGambia, TheGeorgiaGermanyGhanaGreeceGrenadaGuatemalaGuineaGuinea-BissauGuyanaHaitiHeavily indebted poor countries (HIPC)High incomeHondurasHong Kong SAR, ChinaHungaryIBRD onlyIcelandIDA & IBRD totalIDA blendIDA onlyIDA totalIndiaIndonesiaIran, Islamic Rep.IraqIrelandIsraelItalyJamaicaJapanJordanKazakhstanKenyaKiribatiKorea, Rep.KosovoKuwaitKyrgyz RepublicLao PDRLate-demographic dividendLatin America & Caribbean Latin America & Caribbean (excluding high income)Latin America & the Caribbean (IDA & IBRD countries)LatviaLeast developed countries: UN classificationLebanonLesothoLiberiaLibyaLithuaniaLow & middle incomeLow incomeLower middle incomeLuxembourgMacao SAR, ChinaMacedonia, FYRMadagascarMalawiMalaysiaMaliMaltaMarshall IslandsMauritaniaMauritiusMexicoMicronesia, Fed. Sts.Middle East & North AfricaMiddle East & North Africa (excluding high income)Middle East & North Africa (IDA & IBRD countries)Middle incomeMoldovaMongoliaMontenegroMoroccoMozambiqueNamibiaNauruNetherlandsNew ZealandNicaraguaNigerNigeriaNorth AmericaNorwayOECD membersOmanOther small statesPacific island small statesPakistanPalauPanamaPapua New GuineaParaguayPeruPhilippinesPolandPortugalPost-demographic dividendPre-demographic dividendQatarRomaniaRussian FederationRwandaSamoaSao Tome and PrincipeSaudi ArabiaSenegalSerbiaSeychellesSierra LeoneSingaporeSlovak RepublicSloveniaSmall statesSolomon IslandsSouth AfricaSouth AsiaSouth Asia (IDA & IBRD)SpainSri LankaSt. Kitts and NevisSt. LuciaSt. Vincent and the GrenadinesSub-Saharan Africa Sub-Saharan Africa (excluding high income)Sub-Saharan Africa (IDA & IBRD countries)SurinameSwazilandSwedenSwitzerlandSyrian Arab RepublicTajikistanTanzaniaThailandTimor-LesteTogoTongaTrinidad and TobagoTunisiaTurkeyUgandaUkraineUnited Arab EmiratesUnited KingdomUnited StatesUpper middle incomeUruguayVanuatuVenezuela, RBVietnamWest Bank and GazaWorldYemen, Rep.ZambiaZimbabwe Timeline:
This timeline shows a graph from 1971 to 2016 of Spain. No data until 1970. Number of actual observations by date: 46.
Source name:
World Development Indicators
Source organization:
International Monetary Fund, International Financial Statistics and Balance of Payments databases, World Bank, International Debt Statistics, and World Bank and OECD GDP estimates.
Categories, topics:
Economy & Growth, Financial Sector
Last updated:
apr 23, 2017
Indicators value changes by year
Minimum:
-0.188
jan 1, 2013
At the date of observation
Value
Absolute change
Change from previous value
jan 1, 1971
0.105
+0.105
0.0%
jan 1, 1972
0.054
-0.051
-48.88%
jan 1, 1973
0.063
+0.009
16.68%
jan 1, 1974
0.066
+0.004
5.68%
jan 1, 1975
0.088
+0.021
32.15%
jan 1, 1976
0.148
+0.061
69.44%
jan 1, 1977
0.163
+0.015
9.8%
jan 1, 1978
0.087
-0.076
-46.37%
jan 1, 1979
0.064
-0.024
-27.34%
jan 1, 1980
0.062
-0.001
-2.31%
jan 1, 1981
0.134
+0.072
115.71%
jan 1, 1982
0.134
+0.0
0.15%
jan 1, 1983
0.261
+0.127
95.02%
jan 1, 1984
0.143
-0.119
-45.45%
jan 1, 1985
0.145
+0.002
1.47%
jan 1, 1986
0.139
-0.006
-4.11%
jan 1, 1987
0.151
+0.012
8.56%
jan 1, 1988
0.234
+0.084
55.64%
jan 1, 1989
0.329
+0.095
40.37%
jan 1, 1990
0.356
+0.027
8.23%
jan 1, 1991
0.658
+0.302
84.79%
jan 1, 1992
0.772
+0.113
17.24%
jan 1, 1993
0.348
-0.423
-54.87%
jan 1, 1994
0.824
+0.476
136.56%
jan 1, 1995
0.682
-0.142
-17.26%
jan 1, 1996
0.802
+0.12
17.59%
jan 1, 1997
1.13
+0.328
40.91%
jan 1, 1998
2.515
+1.385
122.61%
jan 1, 1999
3.534
+1.019
40.52%
jan 1, 2000
7.127
+3.594
101.7%
jan 1, 2001
9.921
+2.794
39.21%
jan 1, 2002
5.37
-4.551
-45.87%
jan 1, 2003
4.691
-0.679
-12.65%
jan 1, 2004
3.737
-0.953
-20.32%
jan 1, 2005
5.803
+2.066
55.27%
jan 1, 2006
3.807
-1.996
-34.39%
jan 1, 2007
8.327
+4.52
118.7%
jan 1, 2008
9.913
+1.586
19.05%
jan 1, 2009
4.628
-5.285
-53.32%
jan 1, 2010
1.06
-3.568
-77.09%
jan 1, 2011
2.642
+1.582
149.18%
jan 1, 2012
3.023
+0.381
14.43%
jan 1, 2013
-0.188
-3.211
-106.21%
jan 1, 2014
2.012
+2.2
-1.17K%
jan 1, 2015
3.278
+1.266
62.91%
jan 1, 2016
4.823
+1.545
47.14%
Ranking of countries by current statistics by years


Comments: