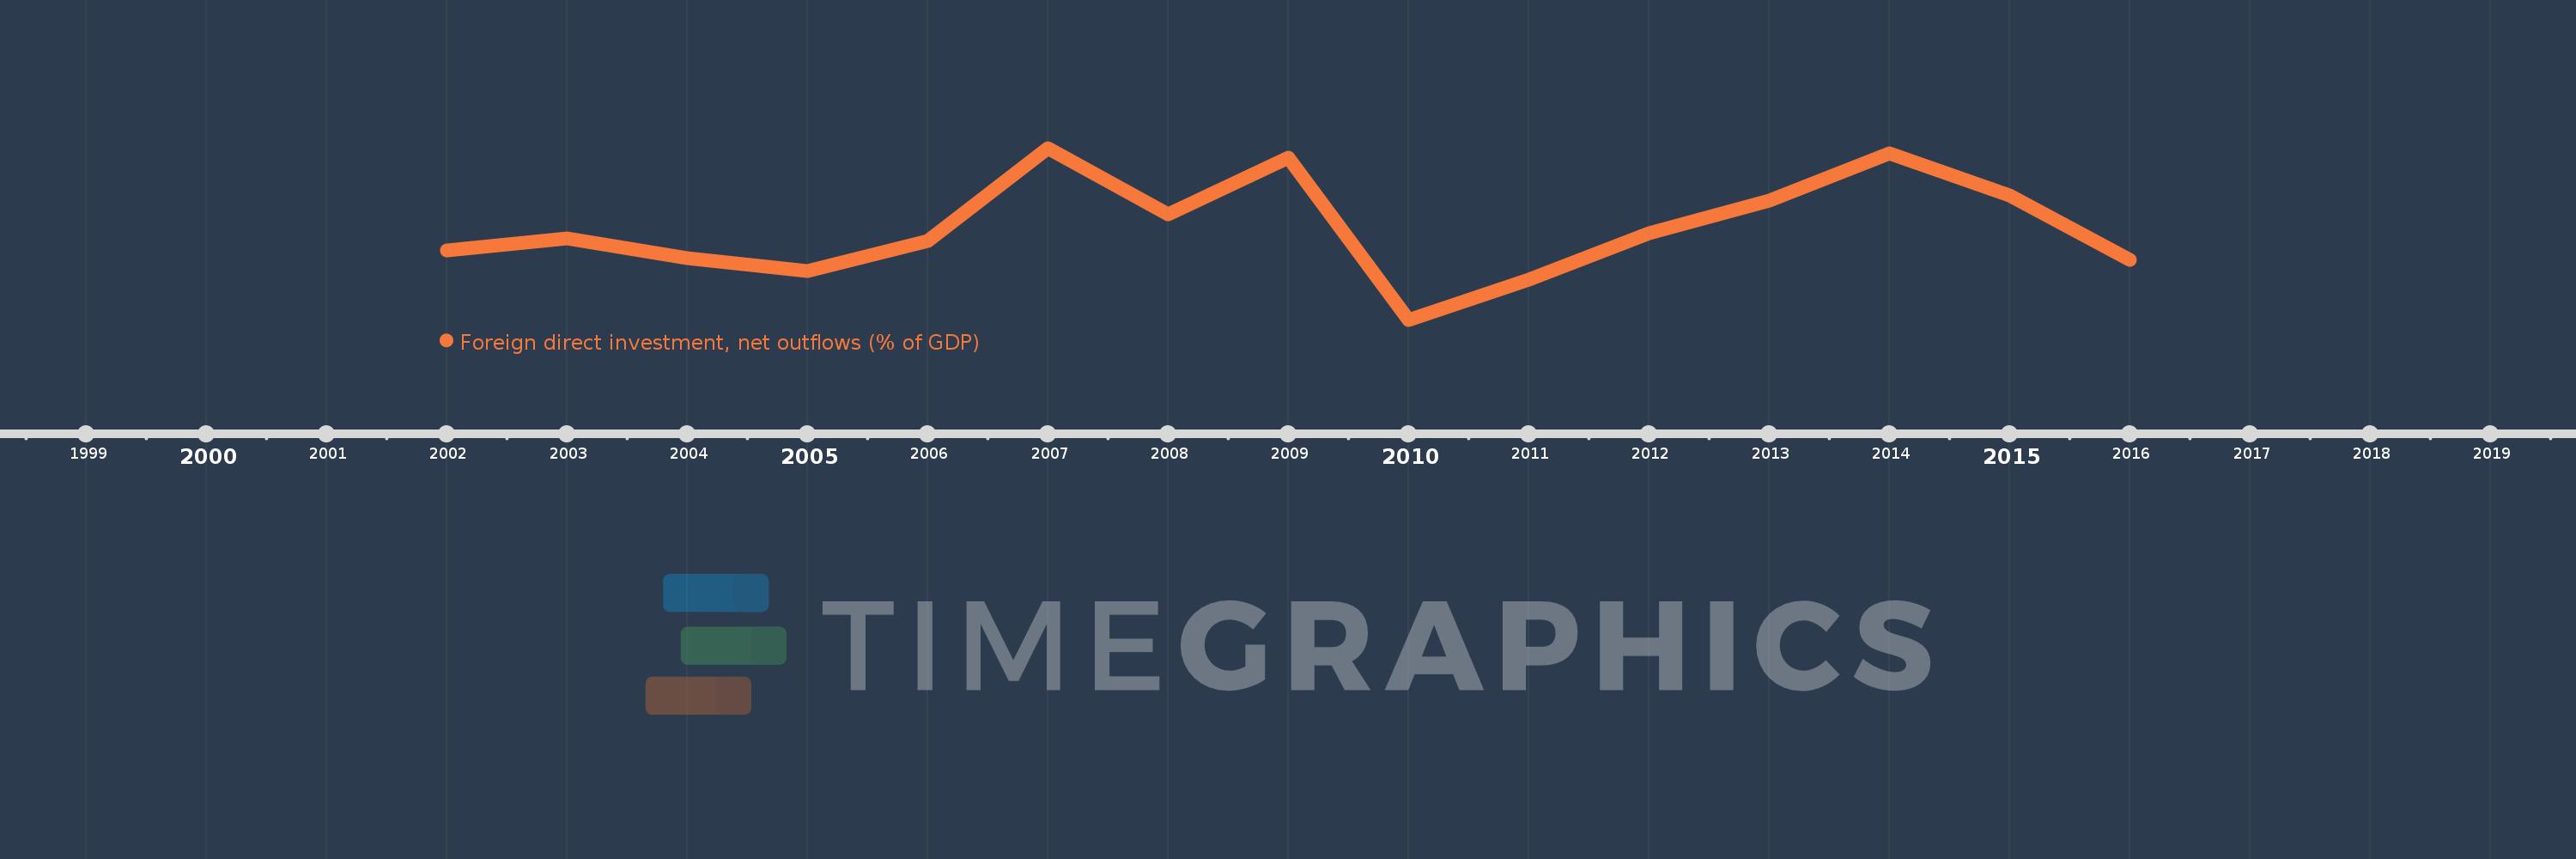
This timeline shows a graph from 2002 to 2016 of Macao SAR, China. No data until 2001. Number of actual observations by date: 15.
Source name:
World Development Indicators
Source organization:
International Monetary Fund, International Financial Statistics and Balance of Payments databases, World Bank, International Debt Statistics, and World Bank and OECD GDP estimates.
Categories, topics:
Economy & Growth, Financial Sector
Last updated:
apr 23, 2017
Indicators value changes by year
Meaning:
1.089
Minimum:
-2.763
jan 1, 2010
Maximum:
4.453
jan 1, 2007
At the date of observation
Value
Absolute change
Change from the previous value
jan 1, 2002
0.156
+0.156
0.0%
jan 1, 2003
0.661
+0.505
324.76%
jan 1, 2004
-0.188
-0.848
-128.38%
jan 1, 2005
-0.728
-0.54
288.12%
jan 1, 2006
0.54
+1.268
-174.18%
jan 1, 2007
4.453
+3.914
724.93%
jan 1, 2008
1.648
-2.806
-63.01%
jan 1, 2009
4.038
+2.391
145.1%
jan 1, 2010
-2.763
-6.801
-168.42%
jan 1, 2011
-1.074
+1.689
-61.15%
jan 1, 2012
0.879
+1.952
-181.83%
jan 1, 2013
2.257
+1.378
156.88%
jan 1, 2014
4.242
+1.986
87.98%
jan 1, 2015
2.458
-1.784
-42.06%
jan 1, 2016
-0.249
-2.707
-110.14%
Ranking of countries by current statistics by years
