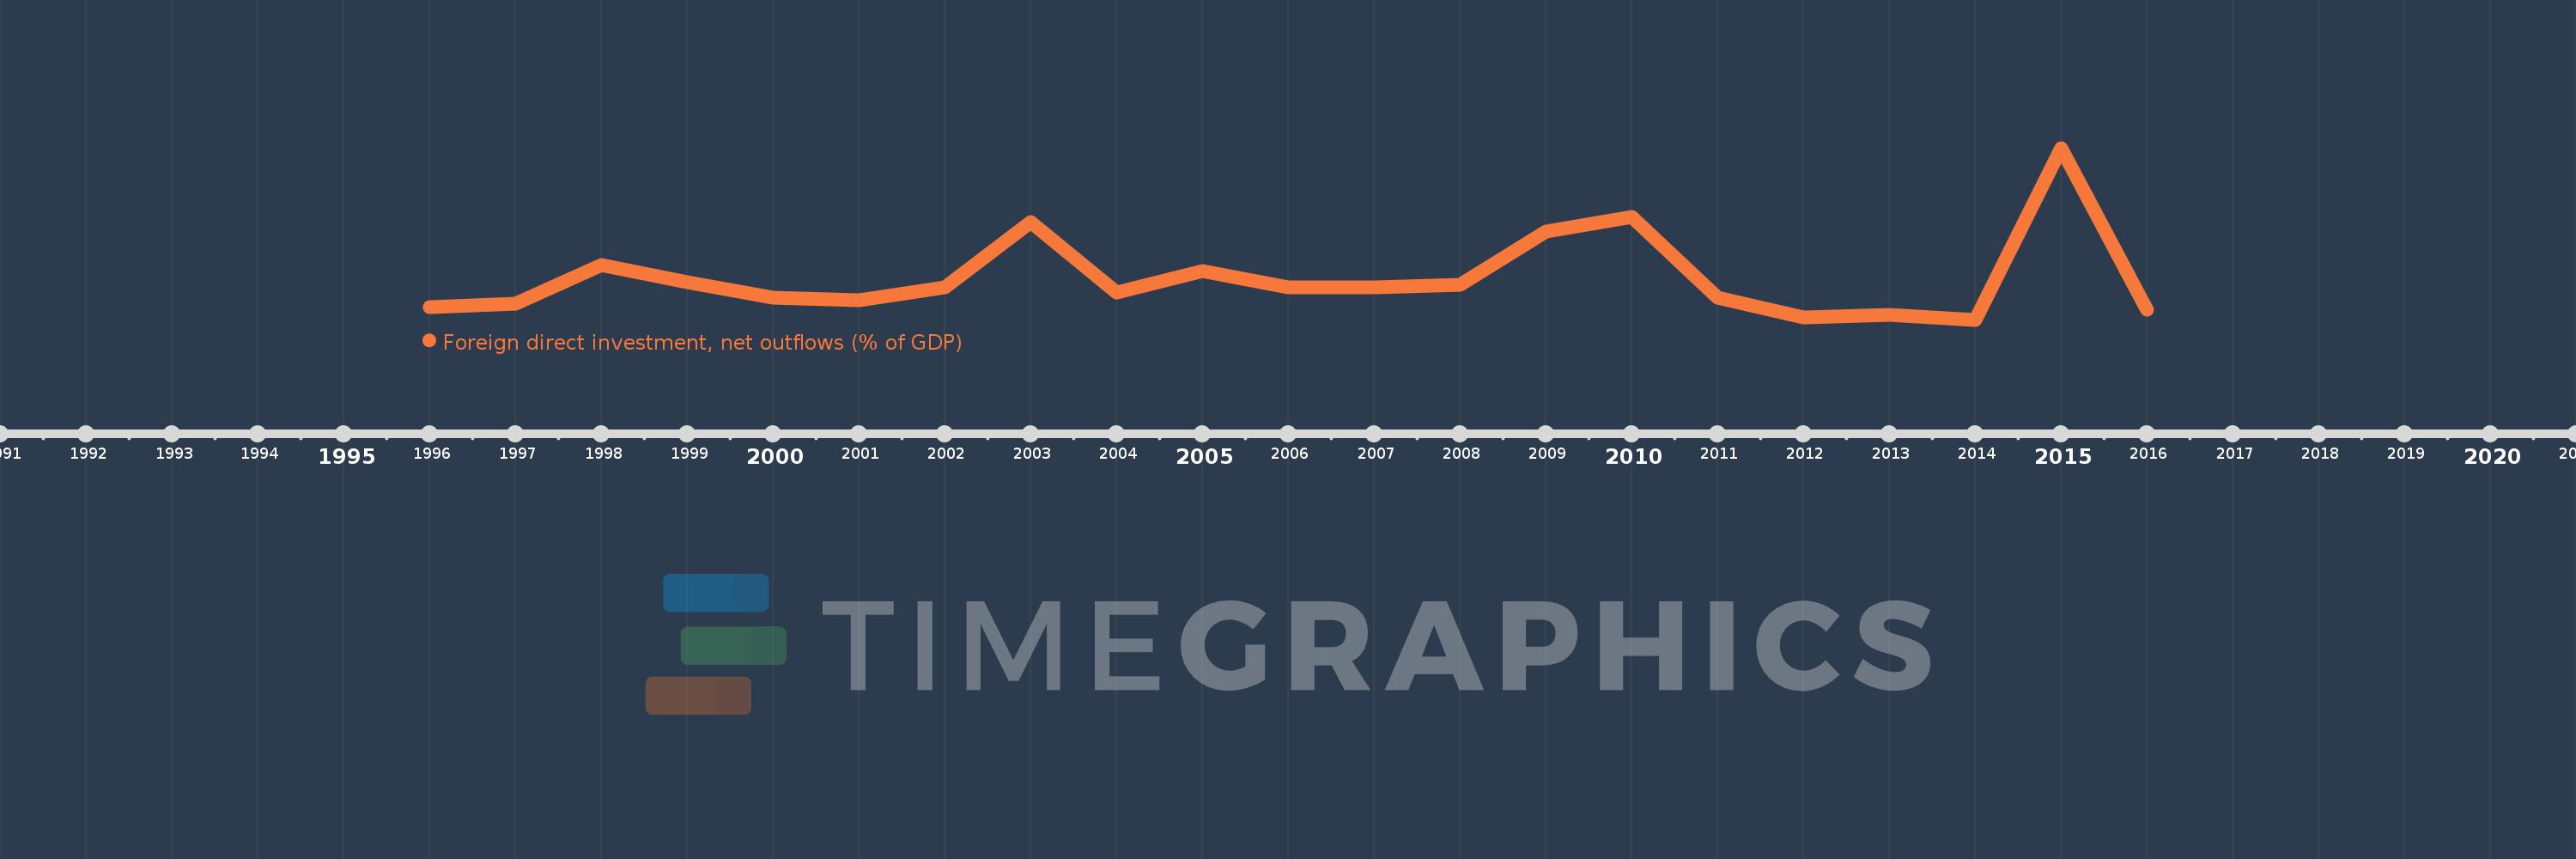
This timeline shows a graph from 1996 to 2016 of Croatia. No data until 1995. Number of actual observations by date: 21.
Source name:
World Development Indicators
Source organization:
International Monetary Fund, International Financial Statistics and Balance of Payments databases, World Bank, International Debt Statistics, and World Bank and OECD GDP estimates.
Categories, topics:
Economy & Growth, Financial Sector
Last updated:
apr 23, 2017
Indicators value changes by year
Meaning:
0.728
Minimum:
-0.276
jan 1, 2014
Maximum:
3.88
jan 1, 2015
At the date of observation
Value
Absolute change
Change from the previous value
jan 1, 1996
0.033
+0.033
0.0%
jan 1, 1997
0.112
+0.079
243.23%
jan 1, 1998
1.044
+0.932
831.23%
jan 1, 1999
0.637
-0.407
-39.0%
jan 1, 2000
0.267
-0.37
-58.13%
jan 1, 2001
0.204
-0.063
-23.61%
jan 1, 2002
0.51
+0.306
150.44%
jan 1, 2003
2.096
+1.586
311.01%
jan 1, 2004
0.387
-1.71
-81.55%
jan 1, 2005
0.898
+0.511
132.09%
jan 1, 2006
0.502
-0.395
-44.03%
jan 1, 2007
0.507
+0.005
0.92%
jan 1, 2008
0.569
+0.062
12.18%
jan 1, 2009
1.866
+1.297
227.97%
jan 1, 2010
2.202
+0.336
18.0%
jan 1, 2011
0.255
-1.947
-88.43%
jan 1, 2012
-0.223
-0.478
-187.4%
jan 1, 2013
-0.154
+0.068
-30.7%
jan 1, 2014
-0.276
-0.122
78.86%
jan 1, 2015
3.88
+4.156
-1.51K%
jan 1, 2016
-0.034
-3.914
-100.89%
Ranking of countries by current statistics by years
