29
/
en
AIzaSyAYiBZKx7MnpbEhh9jyipgxe19OcubqV5w
April 1, 2024
65985
Algeria
DZA
true
2
1
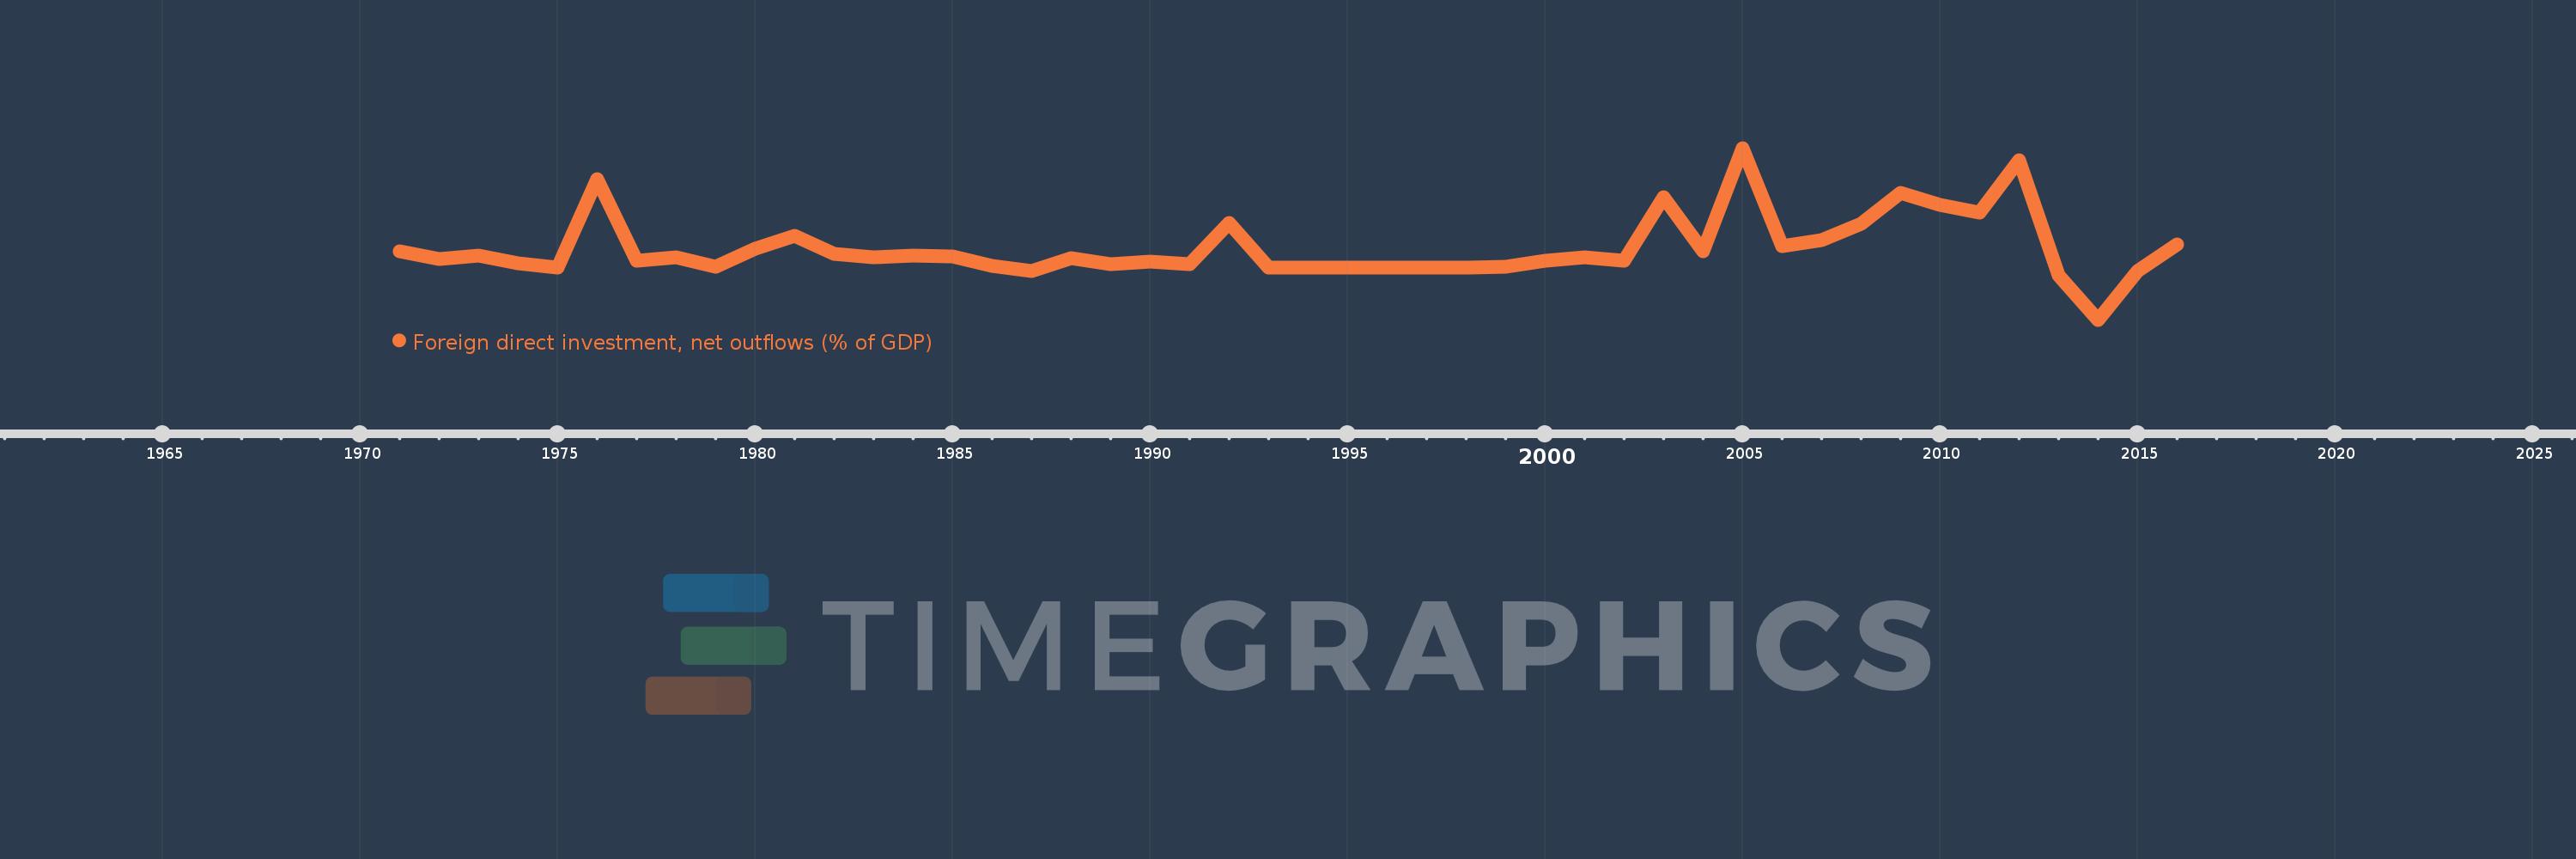
Foreign direct investment, net outflows (% of GDP)
2016,2015,2014,2013,2012,2011,2010,2009,2008,2007,2006,2005,2004,2003,2002,2001,2000,1999,1998,1997,1996,1995,1994,1993,1992,1991,1990,1989,1988,1987,1986,1985,1984,1983,1982,1981,1980,1979,1978,1977,1976,1975,1974,1973,1972,1971
This statistics in other country:
AfghanistanAlbaniaAlgeriaAngolaAntigua and BarbudaArab WorldArgentinaArmeniaArubaAustraliaAustriaAzerbaijanBahamas, TheBahrainBangladeshBarbadosBelarusBelgiumBelizeBeninBermudaBoliviaBosnia and HerzegovinaBotswanaBrazilBrunei DarussalamBulgariaBurkina FasoBurundiCabo VerdeCambodiaCameroonCanadaCaribbean small statesCayman IslandsCentral African RepublicCentral Europe and the BalticsChadChileChinaColombiaComorosCongo, Dem. Rep.Congo, Rep.Costa RicaCote d'IvoireCroatiaCyprusCzech RepublicDenmarkDominicaDominican RepublicEarly-demographic dividendEast Asia & PacificEast Asia & Pacific (excluding high income)East Asia & Pacific (IDA & IBRD countries)EcuadorEgypt, Arab Rep.El SalvadorEquatorial GuineaEritreaEstoniaEuro areaEurope & Central AsiaEurope & Central Asia (excluding high income)Europe & Central Asia (IDA & IBRD countries)European UnionFijiFinlandFragile and conflict affected situationsFranceFrench PolynesiaGabonGambia, TheGeorgiaGermanyGhanaGreeceGrenadaGuatemalaGuineaGuinea-BissauGuyanaHaitiHeavily indebted poor countries (HIPC)High incomeHondurasHong Kong SAR, ChinaHungaryIBRD onlyIcelandIDA & IBRD totalIDA blendIDA onlyIDA totalIndiaIndonesiaIran, Islamic Rep.IraqIrelandIsraelItalyJamaicaJapanJordanKazakhstanKenyaKiribatiKorea, Rep.KosovoKuwaitKyrgyz RepublicLao PDRLate-demographic dividendLatin America & Caribbean Latin America & Caribbean (excluding high income)Latin America & the Caribbean (IDA & IBRD countries)LatviaLeast developed countries: UN classificationLebanonLesothoLiberiaLibyaLithuaniaLow & middle incomeLow incomeLower middle incomeLuxembourgMacao SAR, ChinaMacedonia, FYRMadagascarMalawiMalaysiaMaliMaltaMarshall IslandsMauritaniaMauritiusMexicoMicronesia, Fed. Sts.Middle East & North AfricaMiddle East & North Africa (excluding high income)Middle East & North Africa (IDA & IBRD countries)Middle incomeMoldovaMongoliaMontenegroMoroccoMozambiqueNamibiaNauruNetherlandsNew ZealandNicaraguaNigerNigeriaNorth AmericaNorwayOECD membersOmanOther small statesPacific island small statesPakistanPalauPanamaPapua New GuineaParaguayPeruPhilippinesPolandPortugalPost-demographic dividendPre-demographic dividendQatarRomaniaRussian FederationRwandaSamoaSao Tome and PrincipeSaudi ArabiaSenegalSerbiaSeychellesSierra LeoneSingaporeSlovak RepublicSloveniaSmall statesSolomon IslandsSouth AfricaSouth AsiaSouth Asia (IDA & IBRD)SpainSri LankaSt. Kitts and NevisSt. LuciaSt. Vincent and the GrenadinesSub-Saharan Africa Sub-Saharan Africa (excluding high income)Sub-Saharan Africa (IDA & IBRD countries)SurinameSwazilandSwedenSwitzerlandSyrian Arab RepublicTajikistanTanzaniaThailandTimor-LesteTogoTongaTrinidad and TobagoTunisiaTurkeyUgandaUkraineUnited Arab EmiratesUnited KingdomUnited StatesUpper middle incomeUruguayVanuatuVenezuela, RBVietnamWest Bank and GazaWorldYemen, Rep.ZambiaZimbabwe Timeline:
This timeline shows a graph from 1971 to 2016 of Algeria. No data until 1970. Number of actual observations by date: 46.
Source name:
World Development Indicators
Source organization:
International Monetary Fund, International Financial Statistics and Balance of Payments databases, World Bank, International Debt Statistics, and World Bank and OECD GDP estimates.
Categories, topics:
Economy & Growth, Financial Sector
Last updated:
apr 23, 2017
Indicators value changes by year
At the date of observation
Value
Absolute change
Change from previous value
jan 1, 1971
0.041
+0.041
0.0%
jan 1, 1972
0.02
-0.021
-52.1%
jan 1, 1973
0.03
+0.01
50.17%
jan 1, 1974
0.011
-0.018
-61.21%
jan 1, 1975
0.0
-0.011
-100.0%
jan 1, 1976
0.219
+0.219
%
jan 1, 1977
0.017
-0.202
-92.26%
jan 1, 1978
0.026
+0.01
56.29%
jan 1, 1979
0.001
-0.025
-96.38%
jan 1, 1980
0.047
+0.046
4.8K%
jan 1, 1981
0.079
+0.033
69.48%
jan 1, 1982
0.033
-0.046
-58.54%
jan 1, 1983
0.025
-0.008
-23.9%
jan 1, 1984
0.03
+0.005
19.58%
jan 1, 1985
0.027
-0.003
-8.92%
jan 1, 1986
0.004
-0.023
-84.9%
jan 1, 1987
-0.008
-0.012
-302.62%
jan 1, 1988
0.023
+0.031
-370.2%
jan 1, 1989
0.008
-0.014
-63.21%
jan 1, 1990
0.015
+0.006
76.53%
jan 1, 1991
0.008
-0.007
-48.41%
jan 1, 1992
0.11
+0.102
1.36K%
jan 1, 1993
0.0
-0.11
-100.0%
jan 1, 1994
0.0
0.0
-3.89%
jan 1, 1995
0.0
+0.0
17.4%
jan 1, 1996
0.0
+0.0
1.86%
jan 1, 1997
0.0
0.0
-11.03%
jan 1, 1998
0.0
0.0
-2.57%
jan 1, 1999
0.002
+0.002
99.88K%
jan 1, 2000
0.016
+0.014
652.92%
jan 1, 2001
0.025
+0.009
60.03%
jan 1, 2002
0.017
-0.008
-32.06%
jan 1, 2003
0.174
+0.157
922.57%
jan 1, 2004
0.041
-0.132
-76.25%
jan 1, 2005
0.297
+0.255
618.66%
jan 1, 2006
0.053
-0.243
-82.03%
jan 1, 2007
0.068
+0.014
26.66%
jan 1, 2008
0.109
+0.041
61.32%
jan 1, 2009
0.186
+0.077
70.69%
jan 1, 2010
0.156
-0.03
-15.93%
jan 1, 2011
0.136
-0.02
-12.98%
jan 1, 2012
0.267
+0.131
96.29%
jan 1, 2013
-0.02
-0.287
-107.43%
jan 1, 2014
-0.13
-0.11
553.68%
jan 1, 2015
-0.009
+0.121
-93.34%
jan 1, 2016
0.057
+0.066
-763.11%
Ranking of countries by current statistics by years


Comments: