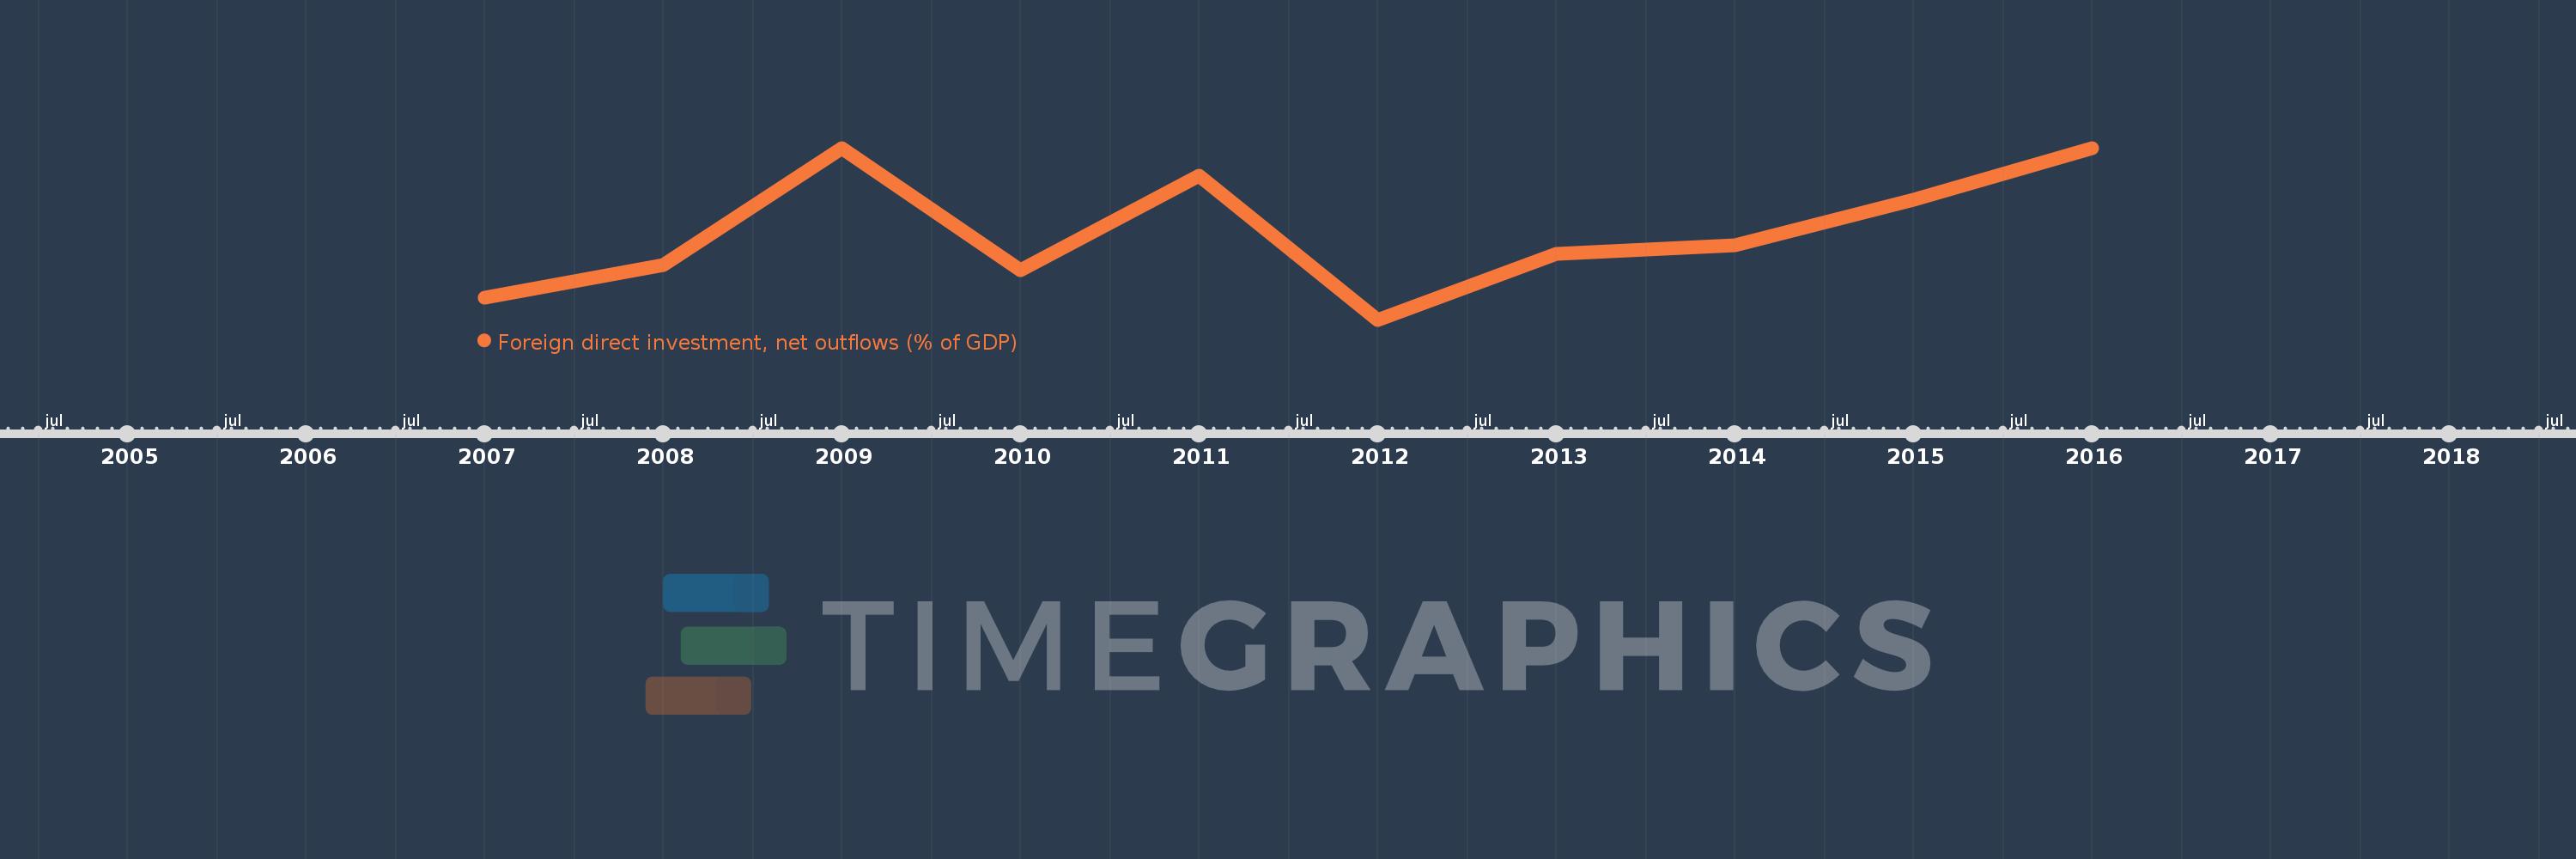
This timeline shows a graph from 2007 to 2016 of Kosovo. No data until 2006. Number of actual observations by date: 10.
Source name:
World Development Indicators
Source organization:
International Monetary Fund, International Financial Statistics and Balance of Payments databases, World Bank, International Debt Statistics, and World Bank and OECD GDP estimates.
Categories, topics:
Economy & Growth, Financial Sector
Last updated:
apr 23, 2017
Indicators value changes by year
Meaning:
0.378
Minimum:
0.103
jan 1, 2012
Maximum:
0.643
jan 1, 2009
At the date of observation
Value
Absolute change
Change from the previous value
jan 1, 2007
0.172
+0.172
0.0%
jan 1, 2008
0.275
+0.102
59.53%
jan 1, 2009
0.643
+0.368
134.09%
jan 1, 2010
0.258
-0.385
-59.88%
jan 1, 2011
0.556
+0.298
115.61%
jan 1, 2012
0.103
-0.453
-81.43%
jan 1, 2013
0.311
+0.208
201.16%
jan 1, 2014
0.337
+0.026
8.29%
jan 1, 2015
0.481
+0.144
42.69%
jan 1, 2016
0.642
+0.161
33.48%
Ranking of countries by current statistics by years
