29
/
en
AIzaSyAYiBZKx7MnpbEhh9jyipgxe19OcubqV5w
April 1, 2024
153523
Iceland
ISL
true
2
1
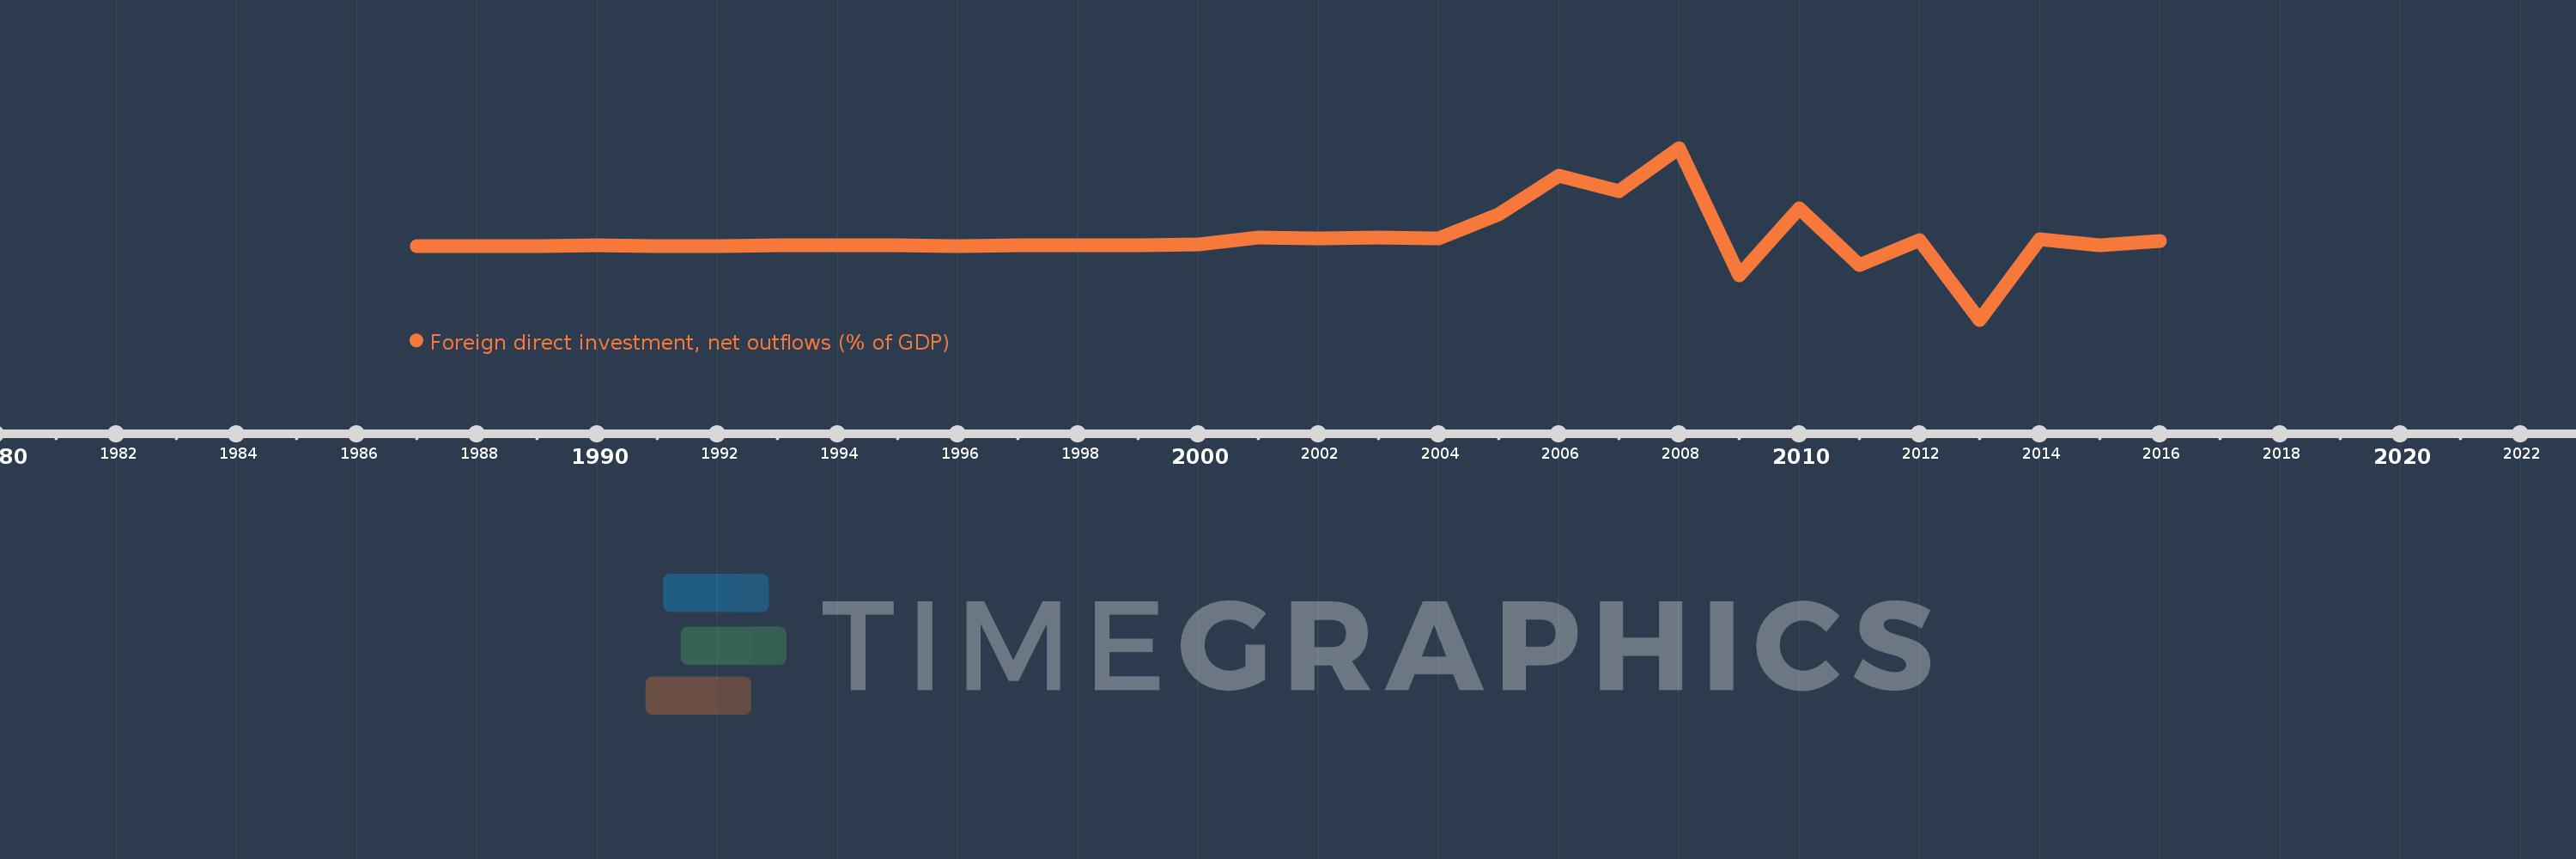
Foreign direct investment, net outflows (% of GDP)
2016,2015,2014,2013,2012,2011,2010,2009,2008,2007,2006,2005,2004,2003,2002,2001,2000,1999,1998,1997,1996,1995,1994,1993,1992,1991,1990,1989,1988,1987
This statistics in other country:
AfghanistanAlbaniaAlgeriaAngolaAntigua and BarbudaArab WorldArgentinaArmeniaArubaAustraliaAustriaAzerbaijanBahamas, TheBahrainBangladeshBarbadosBelarusBelgiumBelizeBeninBermudaBoliviaBosnia and HerzegovinaBotswanaBrazilBrunei DarussalamBulgariaBurkina FasoBurundiCabo VerdeCambodiaCameroonCanadaCaribbean small statesCayman IslandsCentral African RepublicCentral Europe and the BalticsChadChileChinaColombiaComorosCongo, Dem. Rep.Congo, Rep.Costa RicaCote d'IvoireCroatiaCyprusCzech RepublicDenmarkDominicaDominican RepublicEarly-demographic dividendEast Asia & PacificEast Asia & Pacific (excluding high income)East Asia & Pacific (IDA & IBRD countries)EcuadorEgypt, Arab Rep.El SalvadorEquatorial GuineaEritreaEstoniaEuro areaEurope & Central AsiaEurope & Central Asia (excluding high income)Europe & Central Asia (IDA & IBRD countries)European UnionFijiFinlandFragile and conflict affected situationsFranceFrench PolynesiaGabonGambia, TheGeorgiaGermanyGhanaGreeceGrenadaGuatemalaGuineaGuinea-BissauGuyanaHaitiHeavily indebted poor countries (HIPC)High incomeHondurasHong Kong SAR, ChinaHungaryIBRD onlyIcelandIDA & IBRD totalIDA blendIDA onlyIDA totalIndiaIndonesiaIran, Islamic Rep.IraqIrelandIsraelItalyJamaicaJapanJordanKazakhstanKenyaKiribatiKorea, Rep.KosovoKuwaitKyrgyz RepublicLao PDRLate-demographic dividendLatin America & Caribbean Latin America & Caribbean (excluding high income)Latin America & the Caribbean (IDA & IBRD countries)LatviaLeast developed countries: UN classificationLebanonLesothoLiberiaLibyaLithuaniaLow & middle incomeLow incomeLower middle incomeLuxembourgMacao SAR, ChinaMacedonia, FYRMadagascarMalawiMalaysiaMaliMaltaMarshall IslandsMauritaniaMauritiusMexicoMicronesia, Fed. Sts.Middle East & North AfricaMiddle East & North Africa (excluding high income)Middle East & North Africa (IDA & IBRD countries)Middle incomeMoldovaMongoliaMontenegroMoroccoMozambiqueNamibiaNauruNetherlandsNew ZealandNicaraguaNigerNigeriaNorth AmericaNorwayOECD membersOmanOther small statesPacific island small statesPakistanPalauPanamaPapua New GuineaParaguayPeruPhilippinesPolandPortugalPost-demographic dividendPre-demographic dividendQatarRomaniaRussian FederationRwandaSamoaSao Tome and PrincipeSaudi ArabiaSenegalSerbiaSeychellesSierra LeoneSingaporeSlovak RepublicSloveniaSmall statesSolomon IslandsSouth AfricaSouth AsiaSouth Asia (IDA & IBRD)SpainSri LankaSt. Kitts and NevisSt. LuciaSt. Vincent and the GrenadinesSub-Saharan Africa Sub-Saharan Africa (excluding high income)Sub-Saharan Africa (IDA & IBRD countries)SurinameSwazilandSwedenSwitzerlandSyrian Arab RepublicTajikistanTanzaniaThailandTimor-LesteTogoTongaTrinidad and TobagoTunisiaTurkeyUgandaUkraineUnited Arab EmiratesUnited KingdomUnited StatesUpper middle incomeUruguayVanuatuVenezuela, RBVietnamWest Bank and GazaWorldYemen, Rep.ZambiaZimbabwe Timeline:
This timeline shows a graph from 1987 to 2016 of Iceland. No data until 1986. Number of actual observations by date: 30.
Source name:
World Development Indicators
Source organization:
International Monetary Fund, International Financial Statistics and Balance of Payments databases, World Bank, International Debt Statistics, and World Bank and OECD GDP estimates.
Categories, topics:
Economy & Growth, Financial Sector
Last updated:
apr 23, 2017
Indicators value changes by year
Minimum:
-37.445
jan 1, 2013
Maximum:
49.695
jan 1, 2008
At the date of observation
Value
Absolute change
Change from previous value
jan 1, 1987
0.052
+0.052
0.0%
jan 1, 1988
0.013
-0.04
-75.91%
jan 1, 1989
0.018
+0.005
42.06%
jan 1, 1990
0.143
+0.126
702.5%
jan 1, 1991
-0.234
-0.378
-263.37%
jan 1, 1992
-0.118
+0.116
-49.5%
jan 1, 1993
0.394
+0.513
-433.23%
jan 1, 1994
0.229
-0.166
-42.01%
jan 1, 1995
0.415
+0.186
81.56%
jan 1, 1996
0.04
-0.376
-90.47%
jan 1, 1997
0.211
+0.172
434.27%
jan 1, 1998
0.492
+0.28
132.6%
jan 1, 1999
0.314
-0.177
-36.03%
jan 1, 2000
0.947
+0.633
201.24%
jan 1, 2001
4.438
+3.49
368.43%
jan 1, 2002
3.82
-0.618
-13.92%
jan 1, 2003
4.374
+0.554
14.5%
jan 1, 2004
4.027
-0.347
-7.94%
jan 1, 2005
15.933
+11.906
295.66%
jan 1, 2006
35.783
+19.85
124.58%
jan 1, 2007
27.972
-7.811
-21.83%
jan 1, 2008
49.695
+21.724
77.66%
jan 1, 2009
-15.066
-64.761
-130.32%
jan 1, 2010
19.111
+34.177
-226.85%
jan 1, 2011
-9.522
-28.633
-149.82%
jan 1, 2012
3.076
+12.597
-132.3%
jan 1, 2013
-37.445
-40.521
-1.32K%
jan 1, 2014
3.428
+40.873
-109.15%
jan 1, 2015
0.125
-3.303
-96.35%
jan 1, 2016
2.578
+2.453
1.96K%
Ranking of countries by current statistics by years


Comments: