29
/
en
AIzaSyAYiBZKx7MnpbEhh9jyipgxe19OcubqV5w
April 1, 2024
207922
Netherlands
NLD
true
2
1
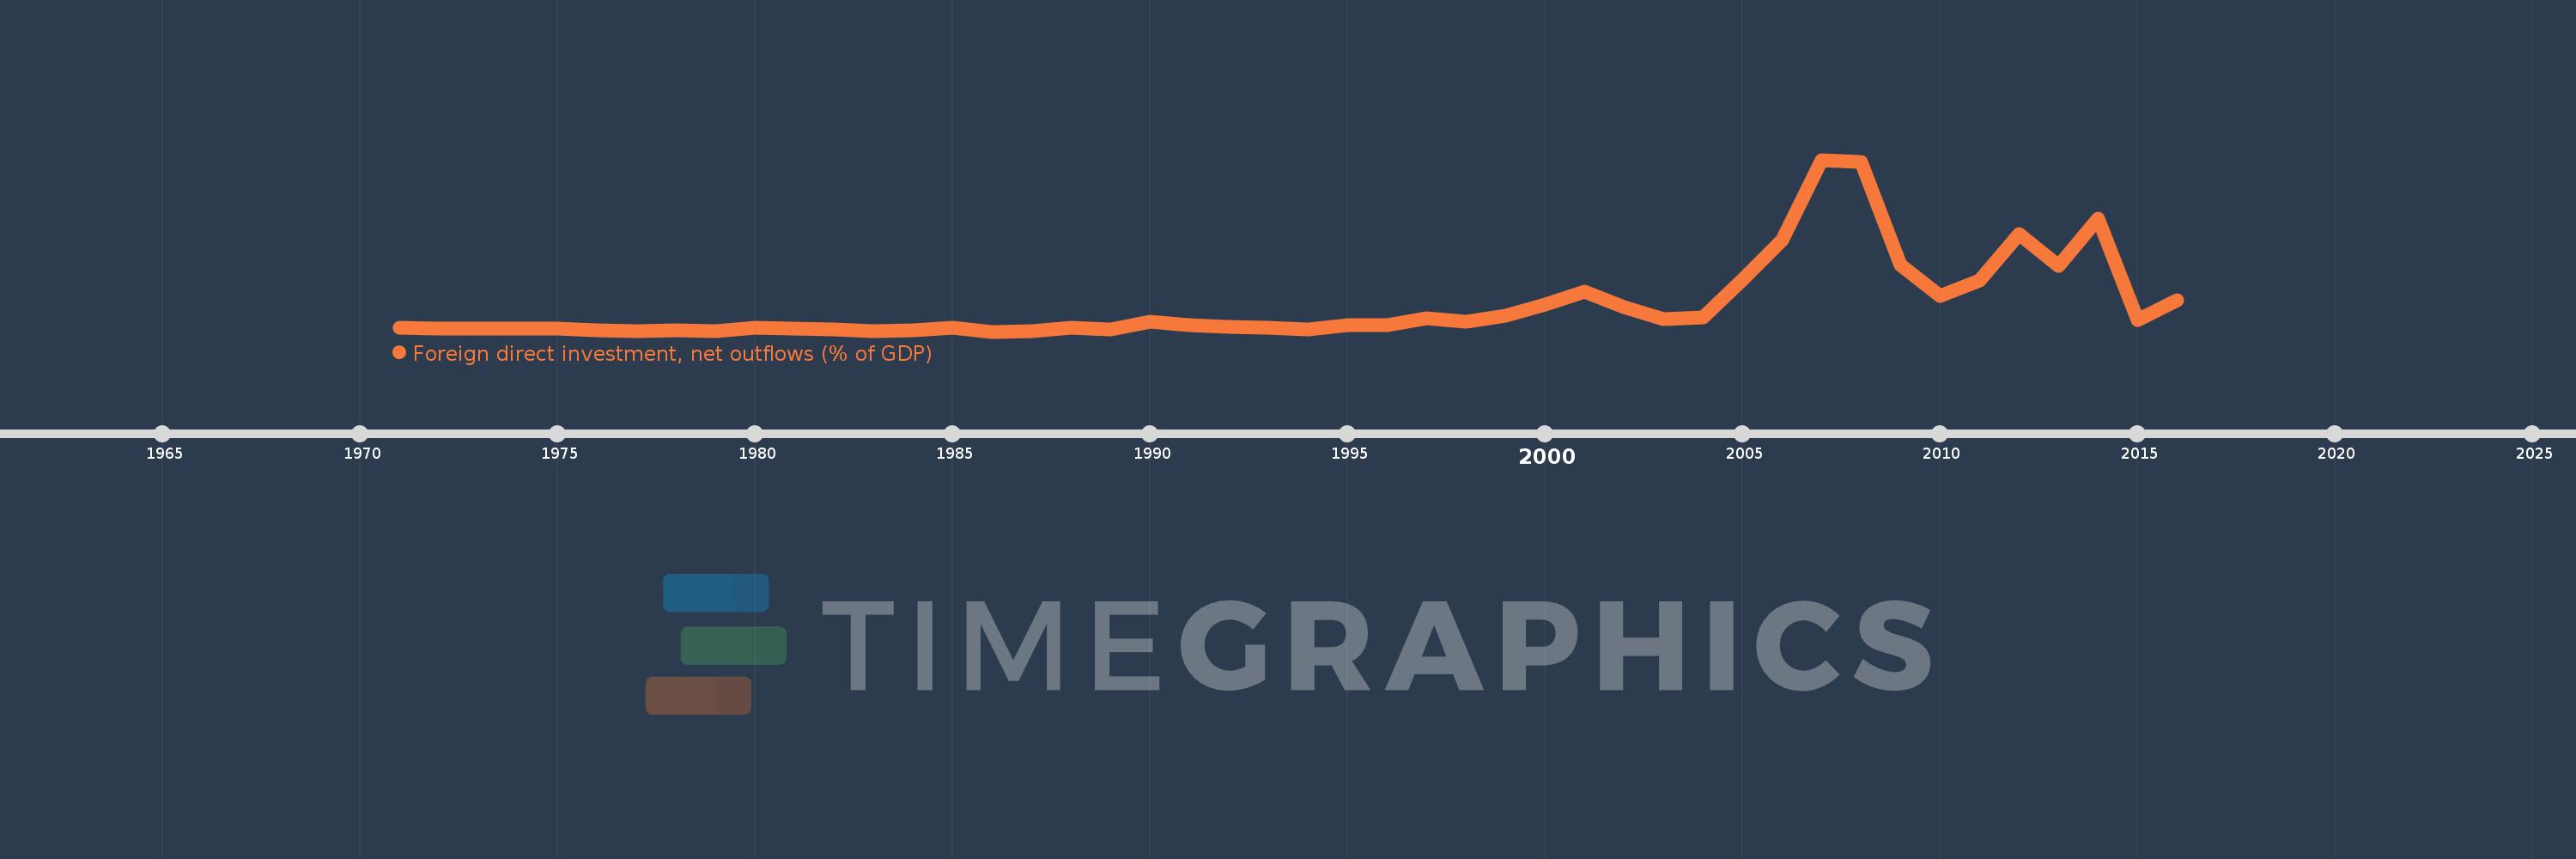
Foreign direct investment, net outflows (% of GDP)
2016,2015,2014,2013,2012,2011,2010,2009,2008,2007,2006,2005,2004,2003,2002,2001,2000,1999,1998,1997,1996,1995,1994,1993,1992,1991,1990,1989,1988,1987,1986,1985,1984,1983,1982,1981,1980,1979,1978,1977,1976,1975,1974,1973,1972,1971
This statistics in other country:
AfghanistanAlbaniaAlgeriaAngolaAntigua and BarbudaArab WorldArgentinaArmeniaArubaAustraliaAustriaAzerbaijanBahamas, TheBahrainBangladeshBarbadosBelarusBelgiumBelizeBeninBermudaBoliviaBosnia and HerzegovinaBotswanaBrazilBrunei DarussalamBulgariaBurkina FasoBurundiCabo VerdeCambodiaCameroonCanadaCaribbean small statesCayman IslandsCentral African RepublicCentral Europe and the BalticsChadChileChinaColombiaComorosCongo, Dem. Rep.Congo, Rep.Costa RicaCote d'IvoireCroatiaCyprusCzech RepublicDenmarkDominicaDominican RepublicEarly-demographic dividendEast Asia & PacificEast Asia & Pacific (excluding high income)East Asia & Pacific (IDA & IBRD countries)EcuadorEgypt, Arab Rep.El SalvadorEquatorial GuineaEritreaEstoniaEuro areaEurope & Central AsiaEurope & Central Asia (excluding high income)Europe & Central Asia (IDA & IBRD countries)European UnionFijiFinlandFragile and conflict affected situationsFranceFrench PolynesiaGabonGambia, TheGeorgiaGermanyGhanaGreeceGrenadaGuatemalaGuineaGuinea-BissauGuyanaHaitiHeavily indebted poor countries (HIPC)High incomeHondurasHong Kong SAR, ChinaHungaryIBRD onlyIcelandIDA & IBRD totalIDA blendIDA onlyIDA totalIndiaIndonesiaIran, Islamic Rep.IraqIrelandIsraelItalyJamaicaJapanJordanKazakhstanKenyaKiribatiKorea, Rep.KosovoKuwaitKyrgyz RepublicLao PDRLate-demographic dividendLatin America & Caribbean Latin America & Caribbean (excluding high income)Latin America & the Caribbean (IDA & IBRD countries)LatviaLeast developed countries: UN classificationLebanonLesothoLiberiaLibyaLithuaniaLow & middle incomeLow incomeLower middle incomeLuxembourgMacao SAR, ChinaMacedonia, FYRMadagascarMalawiMalaysiaMaliMaltaMarshall IslandsMauritaniaMauritiusMexicoMicronesia, Fed. Sts.Middle East & North AfricaMiddle East & North Africa (excluding high income)Middle East & North Africa (IDA & IBRD countries)Middle incomeMoldovaMongoliaMontenegroMoroccoMozambiqueNamibiaNauruNetherlandsNew ZealandNicaraguaNigerNigeriaNorth AmericaNorwayOECD membersOmanOther small statesPacific island small statesPakistanPalauPanamaPapua New GuineaParaguayPeruPhilippinesPolandPortugalPost-demographic dividendPre-demographic dividendQatarRomaniaRussian FederationRwandaSamoaSao Tome and PrincipeSaudi ArabiaSenegalSerbiaSeychellesSierra LeoneSingaporeSlovak RepublicSloveniaSmall statesSolomon IslandsSouth AfricaSouth AsiaSouth Asia (IDA & IBRD)SpainSri LankaSt. Kitts and NevisSt. LuciaSt. Vincent and the GrenadinesSub-Saharan Africa Sub-Saharan Africa (excluding high income)Sub-Saharan Africa (IDA & IBRD countries)SurinameSwazilandSwedenSwitzerlandSyrian Arab RepublicTajikistanTanzaniaThailandTimor-LesteTogoTongaTrinidad and TobagoTunisiaTurkeyUgandaUkraineUnited Arab EmiratesUnited KingdomUnited StatesUpper middle incomeUruguayVanuatuVenezuela, RBVietnamWest Bank and GazaWorldYemen, Rep.ZambiaZimbabwe Timeline:
This timeline shows a graph from 1971 to 2016 of Netherlands. No data until 1970. Number of actual observations by date: 46.
Source name:
World Development Indicators
Source organization:
International Monetary Fund, International Financial Statistics and Balance of Payments databases, World Bank, International Debt Statistics, and World Bank and OECD GDP estimates.
Categories, topics:
Economy & Growth, Financial Sector
Last updated:
apr 23, 2017
Indicators value changes by year
Maximum:
72.012
jan 1, 2007
At the date of observation
Value
Absolute change
Change from previous value
jan 1, 1971
3.495
+3.495
0.0%
jan 1, 1972
2.997
-0.498
-14.24%
jan 1, 1973
3.037
+0.04
1.34%
jan 1, 1974
2.985
-0.053
-1.73%
jan 1, 1975
3.238
+0.253
8.47%
jan 1, 1976
2.545
-0.693
-21.39%
jan 1, 1977
2.183
-0.362
-14.23%
jan 1, 1978
2.423
+0.24
11.01%
jan 1, 1979
2.2
-0.223
-9.19%
jan 1, 1980
3.542
+1.341
60.96%
jan 1, 1981
3.072
-0.47
-13.27%
jan 1, 1982
2.794
-0.278
-9.06%
jan 1, 1983
2.085
-0.708
-25.35%
jan 1, 1984
2.532
+0.446
21.4%
jan 1, 1985
3.41
+0.878
34.67%
jan 1, 1986
1.904
-1.505
-44.15%
jan 1, 1987
2.064
+0.16
8.39%
jan 1, 1988
3.579
+1.515
73.37%
jan 1, 1989
2.752
-0.826
-23.09%
jan 1, 1990
5.826
+3.074
111.67%
jan 1, 1991
4.365
-1.461
-25.08%
jan 1, 1992
3.97
-0.395
-9.06%
jan 1, 1993
3.565
-0.404
-10.18%
jan 1, 1994
2.852
-0.714
-20.01%
jan 1, 1995
4.697
+1.845
64.71%
jan 1, 1996
4.521
-0.176
-3.75%
jan 1, 1997
7.165
+2.644
58.49%
jan 1, 1998
5.944
-1.222
-17.05%
jan 1, 1999
8.541
+2.598
43.7%
jan 1, 2000
12.931
+4.39
51.4%
jan 1, 2001
18.05
+5.119
39.59%
jan 1, 2002
11.9
-6.149
-34.07%
jan 1, 2003
6.824
-5.076
-42.66%
jan 1, 2004
7.806
+0.982
14.39%
jan 1, 2005
23.268
+15.461
198.07%
jan 1, 2006
39.296
+16.028
68.89%
jan 1, 2007
72.012
+32.716
83.26%
jan 1, 2008
71.063
-0.949
-1.32%
jan 1, 2009
29.09
-41.973
-59.06%
jan 1, 2010
16.353
-12.737
-43.78%
jan 1, 2011
22.895
+6.541
40.0%
jan 1, 2012
41.558
+18.664
81.52%
jan 1, 2013
28.714
-12.844
-30.91%
jan 1, 2014
47.982
+19.268
67.1%
jan 1, 2015
6.556
-41.426
-86.34%
jan 1, 2016
14.846
+8.29
126.46%
Ranking of countries by current statistics by years


Comments: