29
/
en
AIzaSyAYiBZKx7MnpbEhh9jyipgxe19OcubqV5w
April 1, 2024
257289
Switzerland
CHE
true
2
1
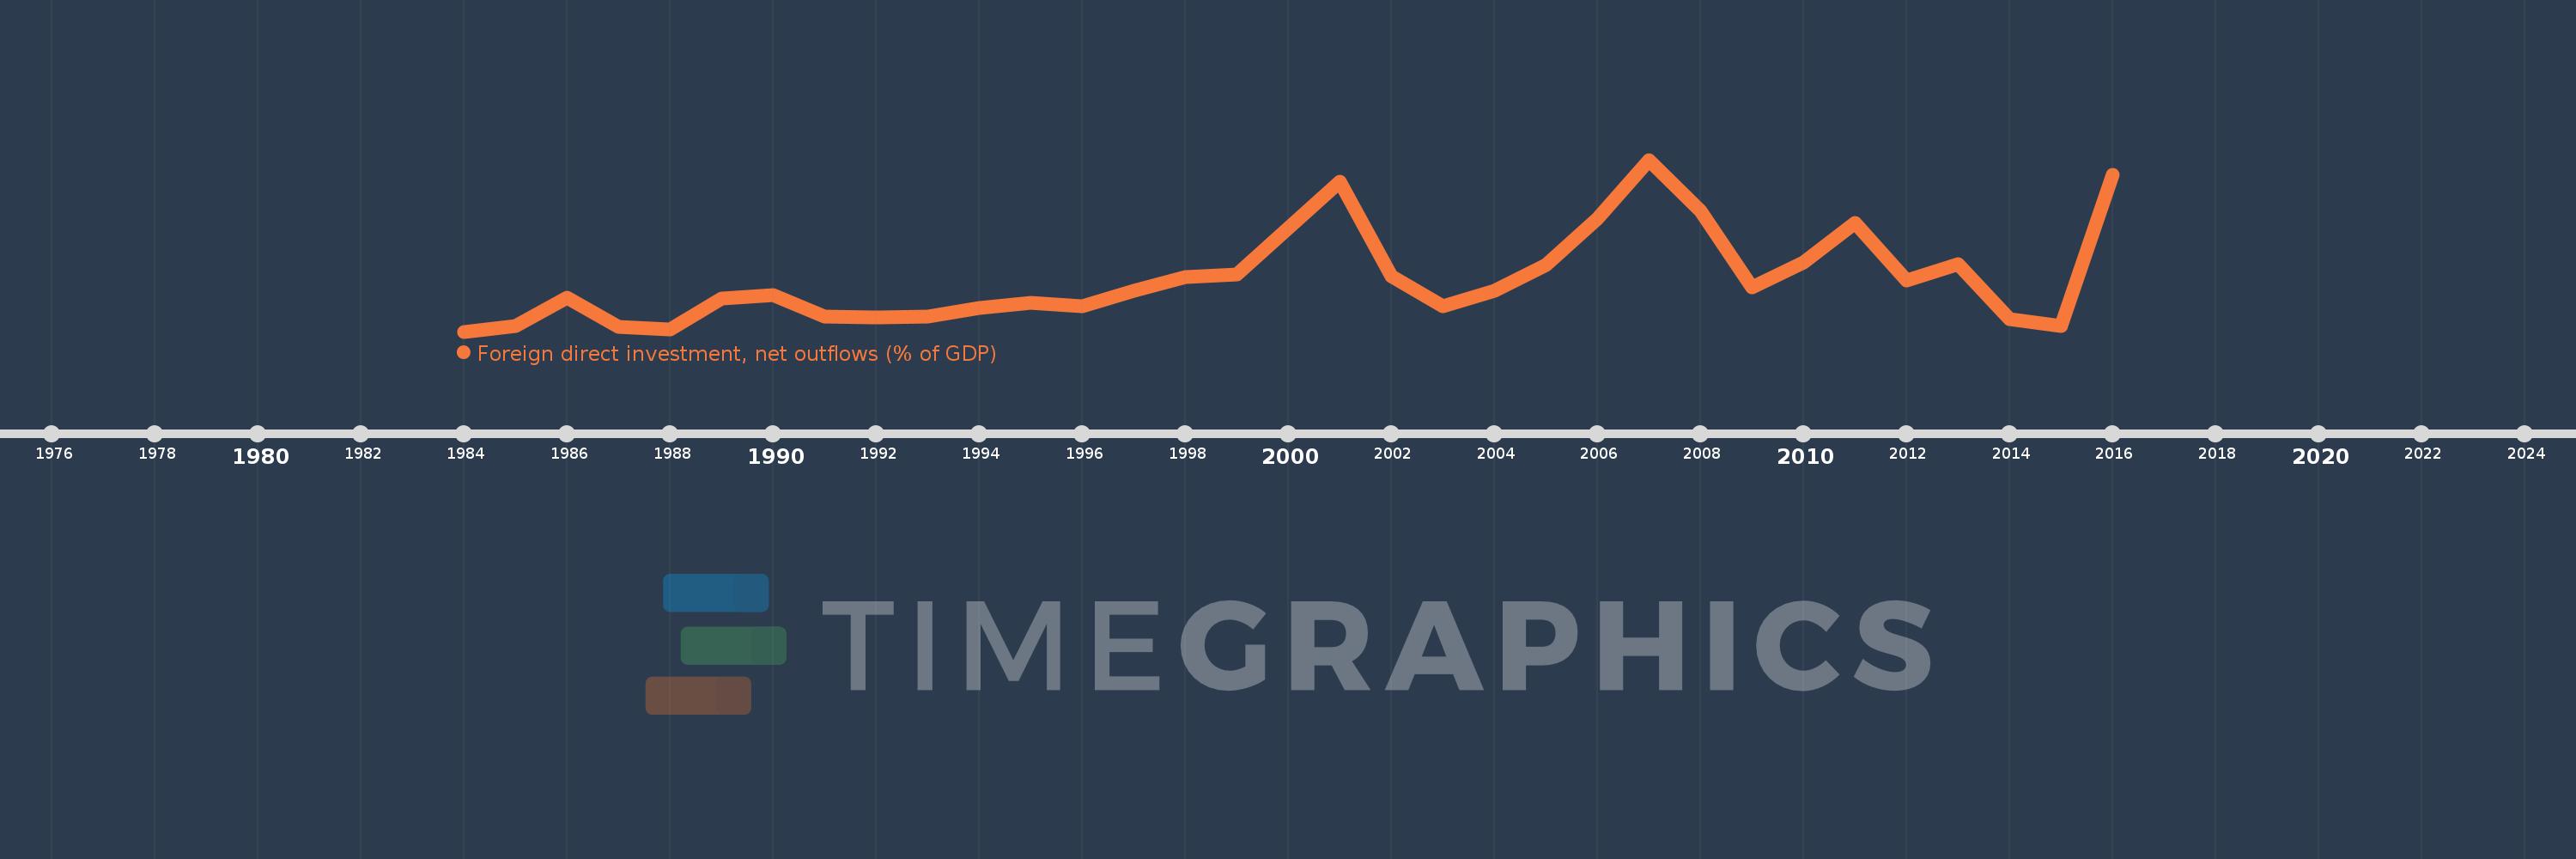
Foreign direct investment, net outflows (% of GDP)
2016,2015,2014,2013,2012,2011,2010,2009,2008,2007,2006,2005,2004,2003,2002,2001,2000,1999,1998,1997,1996,1995,1994,1993,1992,1991,1990,1989,1988,1987,1986,1985,1984
This statistics in other country:
AfghanistanAlbaniaAlgeriaAngolaAntigua and BarbudaArab WorldArgentinaArmeniaArubaAustraliaAustriaAzerbaijanBahamas, TheBahrainBangladeshBarbadosBelarusBelgiumBelizeBeninBermudaBoliviaBosnia and HerzegovinaBotswanaBrazilBrunei DarussalamBulgariaBurkina FasoBurundiCabo VerdeCambodiaCameroonCanadaCaribbean small statesCayman IslandsCentral African RepublicCentral Europe and the BalticsChadChileChinaColombiaComorosCongo, Dem. Rep.Congo, Rep.Costa RicaCote d'IvoireCroatiaCyprusCzech RepublicDenmarkDominicaDominican RepublicEarly-demographic dividendEast Asia & PacificEast Asia & Pacific (excluding high income)East Asia & Pacific (IDA & IBRD countries)EcuadorEgypt, Arab Rep.El SalvadorEquatorial GuineaEritreaEstoniaEuro areaEurope & Central AsiaEurope & Central Asia (excluding high income)Europe & Central Asia (IDA & IBRD countries)European UnionFijiFinlandFragile and conflict affected situationsFranceFrench PolynesiaGabonGambia, TheGeorgiaGermanyGhanaGreeceGrenadaGuatemalaGuineaGuinea-BissauGuyanaHaitiHeavily indebted poor countries (HIPC)High incomeHondurasHong Kong SAR, ChinaHungaryIBRD onlyIcelandIDA & IBRD totalIDA blendIDA onlyIDA totalIndiaIndonesiaIran, Islamic Rep.IraqIrelandIsraelItalyJamaicaJapanJordanKazakhstanKenyaKiribatiKorea, Rep.KosovoKuwaitKyrgyz RepublicLao PDRLate-demographic dividendLatin America & Caribbean Latin America & Caribbean (excluding high income)Latin America & the Caribbean (IDA & IBRD countries)LatviaLeast developed countries: UN classificationLebanonLesothoLiberiaLibyaLithuaniaLow & middle incomeLow incomeLower middle incomeLuxembourgMacao SAR, ChinaMacedonia, FYRMadagascarMalawiMalaysiaMaliMaltaMarshall IslandsMauritaniaMauritiusMexicoMicronesia, Fed. Sts.Middle East & North AfricaMiddle East & North Africa (excluding high income)Middle East & North Africa (IDA & IBRD countries)Middle incomeMoldovaMongoliaMontenegroMoroccoMozambiqueNamibiaNauruNetherlandsNew ZealandNicaraguaNigerNigeriaNorth AmericaNorwayOECD membersOmanOther small statesPacific island small statesPakistanPalauPanamaPapua New GuineaParaguayPeruPhilippinesPolandPortugalPost-demographic dividendPre-demographic dividendQatarRomaniaRussian FederationRwandaSamoaSao Tome and PrincipeSaudi ArabiaSenegalSerbiaSeychellesSierra LeoneSingaporeSlovak RepublicSloveniaSmall statesSolomon IslandsSouth AfricaSouth AsiaSouth Asia (IDA & IBRD)SpainSri LankaSt. Kitts and NevisSt. LuciaSt. Vincent and the GrenadinesSub-Saharan Africa Sub-Saharan Africa (excluding high income)Sub-Saharan Africa (IDA & IBRD countries)SurinameSwazilandSwedenSwitzerlandSyrian Arab RepublicTajikistanTanzaniaThailandTimor-LesteTogoTongaTrinidad and TobagoTunisiaTurkeyUgandaUkraineUnited Arab EmiratesUnited KingdomUnited StatesUpper middle incomeUruguayVanuatuVenezuela, RBVietnamWest Bank and GazaWorldYemen, Rep.ZambiaZimbabwe Timeline:
This timeline shows a graph from 1984 to 2016 of Switzerland. No data until 1983. Number of actual observations by date: 33.
Source name:
World Development Indicators
Source organization:
International Monetary Fund, International Financial Statistics and Balance of Payments databases, World Bank, International Debt Statistics, and World Bank and OECD GDP estimates.
Categories, topics:
Economy & Growth, Financial Sector
Last updated:
apr 23, 2017
Indicators value changes by year
At the date of observation
Value
Absolute change
Change from previous value
jan 1, 1984
0.443
+0.443
0.0%
jan 1, 1985
1.075
+0.631
142.47%
jan 1, 1986
4.254
+3.179
295.86%
jan 1, 1987
0.948
-3.306
-77.72%
jan 1, 1988
0.66
-0.288
-30.37%
jan 1, 1989
4.165
+3.505
531.11%
jan 1, 1990
4.562
+0.397
9.54%
jan 1, 1991
2.148
-2.414
-52.91%
jan 1, 1992
2.095
-0.054
-2.5%
jan 1, 1993
2.122
+0.028
1.33%
jan 1, 1994
3.09
+0.968
45.6%
jan 1, 1995
3.682
+0.592
19.16%
jan 1, 1996
3.303
-0.379
-10.29%
jan 1, 1997
5.054
+1.751
53.0%
jan 1, 1998
6.566
+1.512
29.91%
jan 1, 1999
6.937
+0.372
5.66%
jan 1, 2000
12.202
+5.264
75.88%
jan 1, 2001
17.414
+5.212
42.72%
jan 1, 2002
6.729
-10.685
-61.36%
jan 1, 2003
3.34
-3.389
-50.37%
jan 1, 2004
5.092
+1.753
52.47%
jan 1, 2005
7.957
+2.865
56.25%
jan 1, 2006
13.259
+5.302
66.63%
jan 1, 2007
19.88
+6.621
49.94%
jan 1, 2008
14.093
-5.787
-29.11%
jan 1, 2009
5.491
-8.602
-61.04%
jan 1, 2010
8.286
+2.795
50.9%
jan 1, 2011
12.75
+4.464
53.88%
jan 1, 2012
6.223
-6.527
-51.19%
jan 1, 2013
8.025
+1.802
28.96%
jan 1, 2014
1.834
-6.191
-77.15%
jan 1, 2015
1.063
-0.771
-42.04%
jan 1, 2016
18.146
+17.083
1.61K%
Ranking of countries by current statistics by years


Comments: