29
/
en
AIzaSyAYiBZKx7MnpbEhh9jyipgxe19OcubqV5w
April 1, 2024
91128
Brazil
BRA
true
2
1
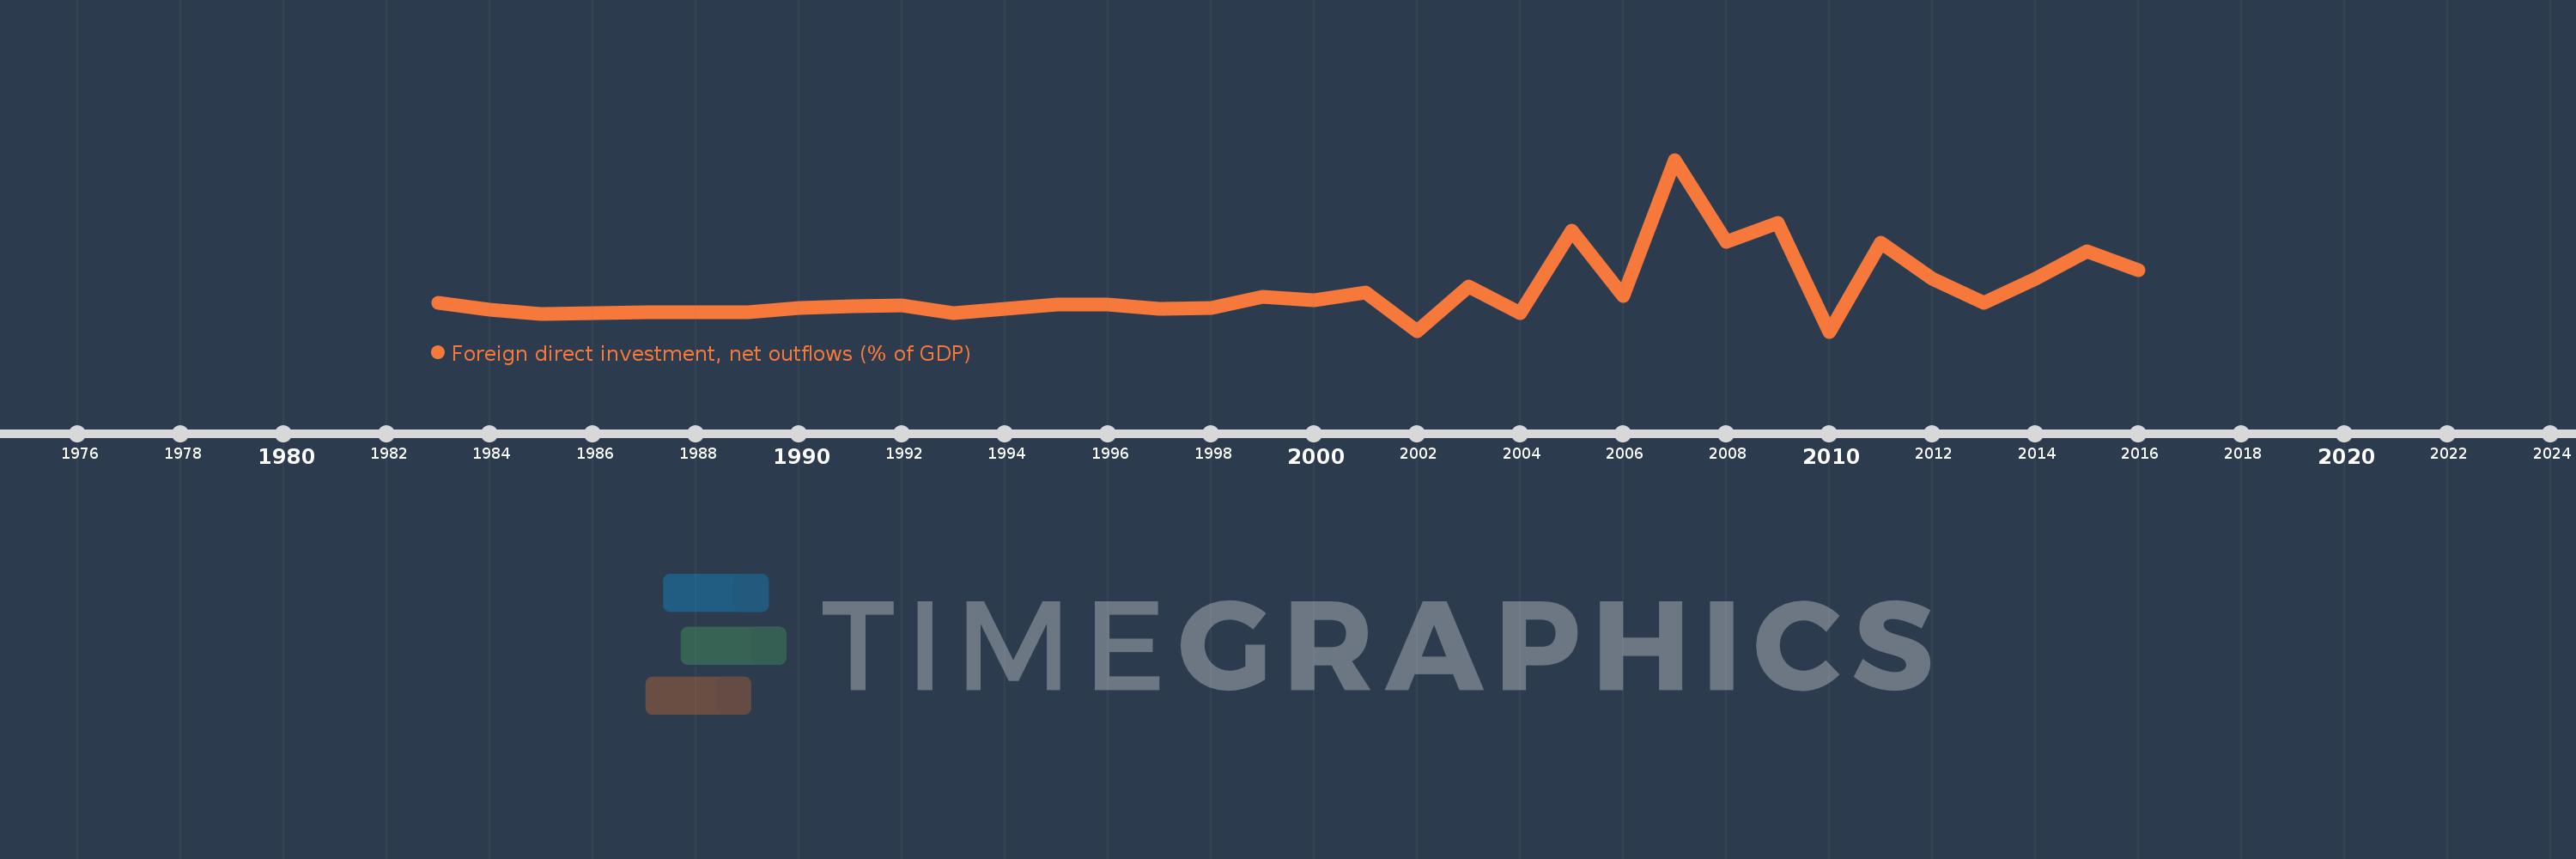
Foreign direct investment, net outflows (% of GDP)
2016,2015,2014,2013,2012,2011,2010,2009,2008,2007,2006,2005,2004,2003,2002,2001,2000,1999,1998,1997,1996,1995,1994,1993,1992,1991,1990,1989,1988,1987,1986,1985,1984,1983
This statistics in other country:
AfghanistanAlbaniaAlgeriaAngolaAntigua and BarbudaArab WorldArgentinaArmeniaArubaAustraliaAustriaAzerbaijanBahamas, TheBahrainBangladeshBarbadosBelarusBelgiumBelizeBeninBermudaBoliviaBosnia and HerzegovinaBotswanaBrazilBrunei DarussalamBulgariaBurkina FasoBurundiCabo VerdeCambodiaCameroonCanadaCaribbean small statesCayman IslandsCentral African RepublicCentral Europe and the BalticsChadChileChinaColombiaComorosCongo, Dem. Rep.Congo, Rep.Costa RicaCote d'IvoireCroatiaCyprusCzech RepublicDenmarkDominicaDominican RepublicEarly-demographic dividendEast Asia & PacificEast Asia & Pacific (excluding high income)East Asia & Pacific (IDA & IBRD countries)EcuadorEgypt, Arab Rep.El SalvadorEquatorial GuineaEritreaEstoniaEuro areaEurope & Central AsiaEurope & Central Asia (excluding high income)Europe & Central Asia (IDA & IBRD countries)European UnionFijiFinlandFragile and conflict affected situationsFranceFrench PolynesiaGabonGambia, TheGeorgiaGermanyGhanaGreeceGrenadaGuatemalaGuineaGuinea-BissauGuyanaHaitiHeavily indebted poor countries (HIPC)High incomeHondurasHong Kong SAR, ChinaHungaryIBRD onlyIcelandIDA & IBRD totalIDA blendIDA onlyIDA totalIndiaIndonesiaIran, Islamic Rep.IraqIrelandIsraelItalyJamaicaJapanJordanKazakhstanKenyaKiribatiKorea, Rep.KosovoKuwaitKyrgyz RepublicLao PDRLate-demographic dividendLatin America & Caribbean Latin America & Caribbean (excluding high income)Latin America & the Caribbean (IDA & IBRD countries)LatviaLeast developed countries: UN classificationLebanonLesothoLiberiaLibyaLithuaniaLow & middle incomeLow incomeLower middle incomeLuxembourgMacao SAR, ChinaMacedonia, FYRMadagascarMalawiMalaysiaMaliMaltaMarshall IslandsMauritaniaMauritiusMexicoMicronesia, Fed. Sts.Middle East & North AfricaMiddle East & North Africa (excluding high income)Middle East & North Africa (IDA & IBRD countries)Middle incomeMoldovaMongoliaMontenegroMoroccoMozambiqueNamibiaNauruNetherlandsNew ZealandNicaraguaNigerNigeriaNorth AmericaNorwayOECD membersOmanOther small statesPacific island small statesPakistanPalauPanamaPapua New GuineaParaguayPeruPhilippinesPolandPortugalPost-demographic dividendPre-demographic dividendQatarRomaniaRussian FederationRwandaSamoaSao Tome and PrincipeSaudi ArabiaSenegalSerbiaSeychellesSierra LeoneSingaporeSlovak RepublicSloveniaSmall statesSolomon IslandsSouth AfricaSouth AsiaSouth Asia (IDA & IBRD)SpainSri LankaSt. Kitts and NevisSt. LuciaSt. Vincent and the GrenadinesSub-Saharan Africa Sub-Saharan Africa (excluding high income)Sub-Saharan Africa (IDA & IBRD countries)SurinameSwazilandSwedenSwitzerlandSyrian Arab RepublicTajikistanTanzaniaThailandTimor-LesteTogoTongaTrinidad and TobagoTunisiaTurkeyUgandaUkraineUnited Arab EmiratesUnited KingdomUnited StatesUpper middle incomeUruguayVanuatuVenezuela, RBVietnamWest Bank and GazaWorldYemen, Rep.ZambiaZimbabwe Timeline:
This timeline shows a graph from 1983 to 2016 of Brazil. No data until 1982. Number of actual observations by date: 34.
Source name:
World Development Indicators
Source organization:
International Monetary Fund, International Financial Statistics and Balance of Payments databases, World Bank, International Debt Statistics, and World Bank and OECD GDP estimates.
Categories, topics:
Economy & Growth, Financial Sector
Last updated:
apr 23, 2017
Indicators value changes by year
Minimum:
-0.273
jan 1, 2010
At the date of observation
Value
Absolute change
Change from previous value
jan 1, 1983
0.205
+0.205
0.0%
jan 1, 1984
0.088
-0.117
-57.13%
jan 1, 1985
0.021
-0.067
-76.13%
jan 1, 1986
0.037
+0.016
76.96%
jan 1, 1987
0.054
+0.017
44.9%
jan 1, 1988
0.047
-0.007
-12.39%
jan 1, 1989
0.053
+0.006
12.63%
jan 1, 1990
0.123
+0.07
131.94%
jan 1, 1991
0.144
+0.021
17.14%
jan 1, 1992
0.168
+0.024
16.84%
jan 1, 1993
0.034
-0.134
-79.67%
jan 1, 1994
0.112
+0.078
227.94%
jan 1, 1995
0.186
+0.074
65.67%
jan 1, 1996
0.176
-0.01
-5.19%
jan 1, 1997
0.104
-0.072
-40.93%
jan 1, 1998
0.118
+0.014
13.37%
jan 1, 1999
0.315
+0.197
167.02%
jan 1, 2000
0.25
-0.065
-20.67%
jan 1, 2001
0.381
+0.131
52.44%
jan 1, 2002
-0.266
-0.647
-169.87%
jan 1, 2003
0.488
+0.754
-283.29%
jan 1, 2004
0.041
-0.447
-91.6%
jan 1, 2005
1.417
+1.376
3.36K%
jan 1, 2006
0.326
-1.091
-76.97%
jan 1, 2007
2.6
+2.274
696.53%
jan 1, 2008
1.221
-1.379
-53.03%
jan 1, 2009
1.54
+0.319
26.1%
jan 1, 2010
-0.273
-1.813
-117.73%
jan 1, 2011
1.212
+1.485
-543.73%
jan 1, 2012
0.615
-0.597
-49.28%
jan 1, 2013
0.212
-0.403
-65.56%
jan 1, 2014
0.606
+0.394
186.33%
jan 1, 2015
1.077
+0.471
77.79%
jan 1, 2016
0.761
-0.317
-29.4%
Ranking of countries by current statistics by years


Comments: