29
/
en
AIzaSyAYiBZKx7MnpbEhh9jyipgxe19OcubqV5w
April 1, 2024
62585
World
WLD
false
2
1
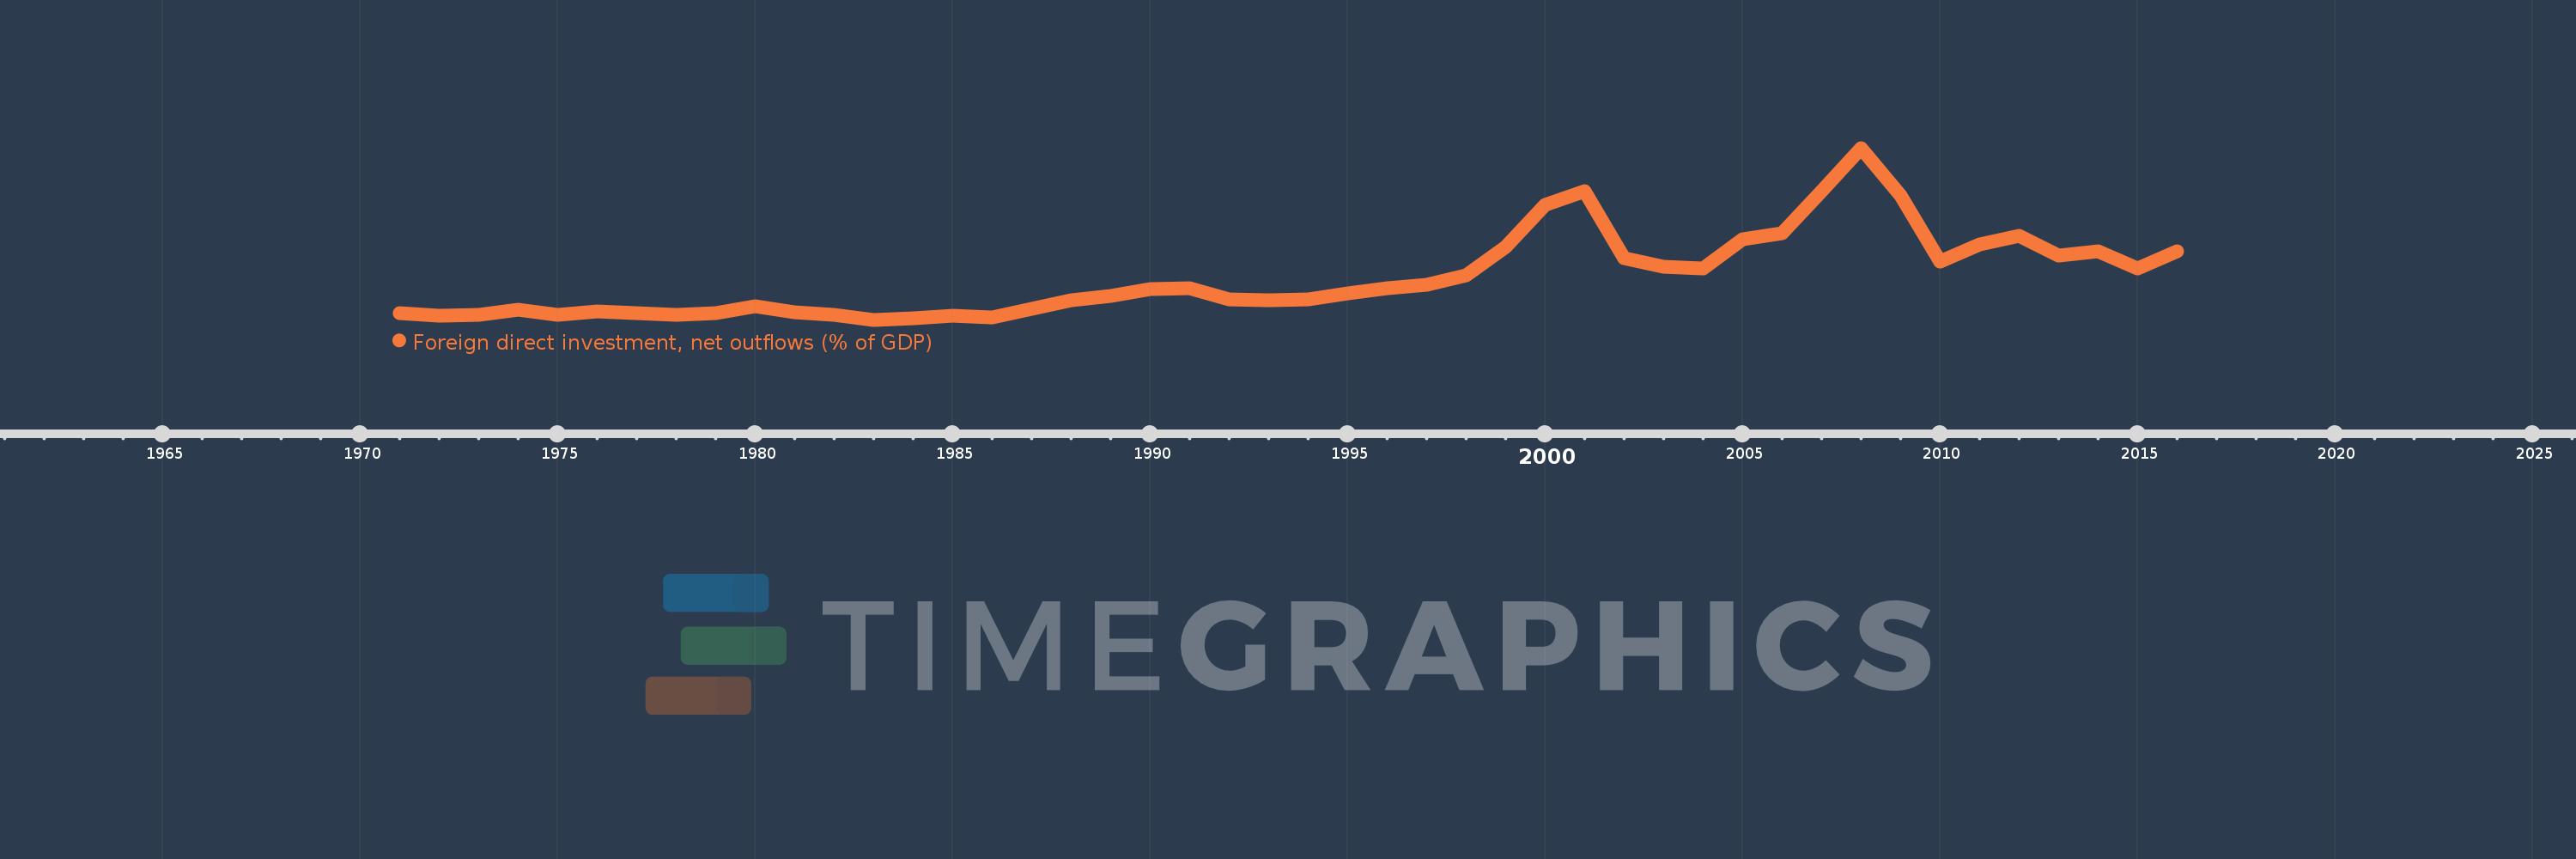
Foreign direct investment, net outflows (% of GDP)
2016,2015,2014,2013,2012,2011,2010,2009,2008,2007,2006,2005,2004,2003,2002,2001,2000,1999,1998,1997,1996,1995,1994,1993,1992,1991,1990,1989,1988,1987,1986,1985,1984,1983,1982,1981,1980,1979,1978,1977,1976,1975,1974,1973,1972,1971
This statistics in other country:
AfghanistanAlbaniaAlgeriaAngolaAntigua and BarbudaArab WorldArgentinaArmeniaArubaAustraliaAustriaAzerbaijanBahamas, TheBahrainBangladeshBarbadosBelarusBelgiumBelizeBeninBermudaBoliviaBosnia and HerzegovinaBotswanaBrazilBrunei DarussalamBulgariaBurkina FasoBurundiCabo VerdeCambodiaCameroonCanadaCaribbean small statesCayman IslandsCentral African RepublicCentral Europe and the BalticsChadChileChinaColombiaComorosCongo, Dem. Rep.Congo, Rep.Costa RicaCote d'IvoireCroatiaCyprusCzech RepublicDenmarkDominicaDominican RepublicEarly-demographic dividendEast Asia & PacificEast Asia & Pacific (excluding high income)East Asia & Pacific (IDA & IBRD countries)EcuadorEgypt, Arab Rep.El SalvadorEquatorial GuineaEritreaEstoniaEuro areaEurope & Central AsiaEurope & Central Asia (excluding high income)Europe & Central Asia (IDA & IBRD countries)European UnionFijiFinlandFragile and conflict affected situationsFranceFrench PolynesiaGabonGambia, TheGeorgiaGermanyGhanaGreeceGrenadaGuatemalaGuineaGuinea-BissauGuyanaHaitiHeavily indebted poor countries (HIPC)High incomeHondurasHong Kong SAR, ChinaHungaryIBRD onlyIcelandIDA & IBRD totalIDA blendIDA onlyIDA totalIndiaIndonesiaIran, Islamic Rep.IraqIrelandIsraelItalyJamaicaJapanJordanKazakhstanKenyaKiribatiKorea, Rep.KosovoKuwaitKyrgyz RepublicLao PDRLate-demographic dividendLatin America & Caribbean Latin America & Caribbean (excluding high income)Latin America & the Caribbean (IDA & IBRD countries)LatviaLeast developed countries: UN classificationLebanonLesothoLiberiaLibyaLithuaniaLow & middle incomeLow incomeLower middle incomeLuxembourgMacao SAR, ChinaMacedonia, FYRMadagascarMalawiMalaysiaMaliMaltaMarshall IslandsMauritaniaMauritiusMexicoMicronesia, Fed. Sts.Middle East & North AfricaMiddle East & North Africa (excluding high income)Middle East & North Africa (IDA & IBRD countries)Middle incomeMoldovaMongoliaMontenegroMoroccoMozambiqueNamibiaNauruNetherlandsNew ZealandNicaraguaNigerNigeriaNorth AmericaNorwayOECD membersOmanOther small statesPacific island small statesPakistanPalauPanamaPapua New GuineaParaguayPeruPhilippinesPolandPortugalPost-demographic dividendPre-demographic dividendQatarRomaniaRussian FederationRwandaSamoaSao Tome and PrincipeSaudi ArabiaSenegalSerbiaSeychellesSierra LeoneSingaporeSlovak RepublicSloveniaSmall statesSolomon IslandsSouth AfricaSouth AsiaSouth Asia (IDA & IBRD)SpainSri LankaSt. Kitts and NevisSt. LuciaSt. Vincent and the GrenadinesSub-Saharan Africa Sub-Saharan Africa (excluding high income)Sub-Saharan Africa (IDA & IBRD countries)SurinameSwazilandSwedenSwitzerlandSyrian Arab RepublicTajikistanTanzaniaThailandTimor-LesteTogoTongaTrinidad and TobagoTunisiaTurkeyUgandaUkraineUnited Arab EmiratesUnited KingdomUnited StatesUpper middle incomeUruguayVanuatuVenezuela, RBVietnamWest Bank and GazaWorldYemen, Rep.ZambiaZimbabwe Timeline:
This timeline shows a graph from 1971 to 2016 of World. No data until 1970. Number of actual observations by date: 46.
Source name:
World Development Indicators
Source organization:
International Monetary Fund, International Financial Statistics and Balance of Payments databases, World Bank, International Debt Statistics, and World Bank and OECD GDP estimates.
Categories, topics:
Economy & Growth, Financial Sector
Last updated:
apr 23, 2017
Indicators value changes by year
At the date of observation
Value
Absolute change
Change from previous value
jan 1, 1971
0.575
+0.575
0.0%
jan 1, 1972
0.489
-0.086
-14.97%
jan 1, 1973
0.514
+0.026
5.24%
jan 1, 1974
0.663
+0.149
28.98%
jan 1, 1975
0.505
-0.158
-23.89%
jan 1, 1976
0.614
+0.109
21.56%
jan 1, 1977
0.559
-0.055
-8.97%
jan 1, 1978
0.502
-0.057
-10.15%
jan 1, 1979
0.556
+0.054
10.83%
jan 1, 1980
0.773
+0.217
38.94%
jan 1, 1981
0.582
-0.191
-24.67%
jan 1, 1982
0.521
-0.061
-10.49%
jan 1, 1983
0.369
-0.153
-29.26%
jan 1, 1984
0.408
+0.039
10.63%
jan 1, 1985
0.489
+0.081
19.83%
jan 1, 1986
0.445
-0.044
-9.0%
jan 1, 1987
0.692
+0.248
55.69%
jan 1, 1988
0.941
+0.249
35.9%
jan 1, 1989
1.065
+0.124
13.17%
jan 1, 1990
1.284
+0.219
20.54%
jan 1, 1991
1.306
+0.023
1.77%
jan 1, 1992
0.978
-0.328
-25.12%
jan 1, 1993
0.934
-0.044
-4.53%
jan 1, 1994
0.982
+0.048
5.18%
jan 1, 1995
1.141
+0.159
16.21%
jan 1, 1996
1.308
+0.166
14.58%
jan 1, 1997
1.406
+0.099
7.53%
jan 1, 1998
1.672
+0.266
18.9%
jan 1, 1999
2.522
+0.85
50.83%
jan 1, 2000
3.769
+1.247
49.46%
jan 1, 2001
4.167
+0.397
10.54%
jan 1, 2002
2.189
-1.978
-47.47%
jan 1, 2003
1.936
-0.253
-11.54%
jan 1, 2004
1.874
-0.062
-3.22%
jan 1, 2005
2.756
+0.882
47.06%
jan 1, 2006
2.924
+0.168
6.1%
jan 1, 2007
4.175
+1.251
42.78%
jan 1, 2008
5.45
+1.275
30.55%
jan 1, 2009
4.057
-1.393
-25.56%
jan 1, 2010
2.083
-1.974
-48.66%
jan 1, 2011
2.602
+0.519
24.92%
jan 1, 2012
2.861
+0.26
9.98%
jan 1, 2013
2.274
-0.588
-20.55%
jan 1, 2014
2.387
+0.114
4.99%
jan 1, 2015
1.895
-0.492
-20.62%
jan 1, 2016
2.399
+0.504
26.62%
Ranking of countries by current statistics by years


Comments: