29
/
en
AIzaSyAYiBZKx7MnpbEhh9jyipgxe19OcubqV5w
April 1, 2024
124785
Egypt, Arab Rep.
EGY
true
2
1
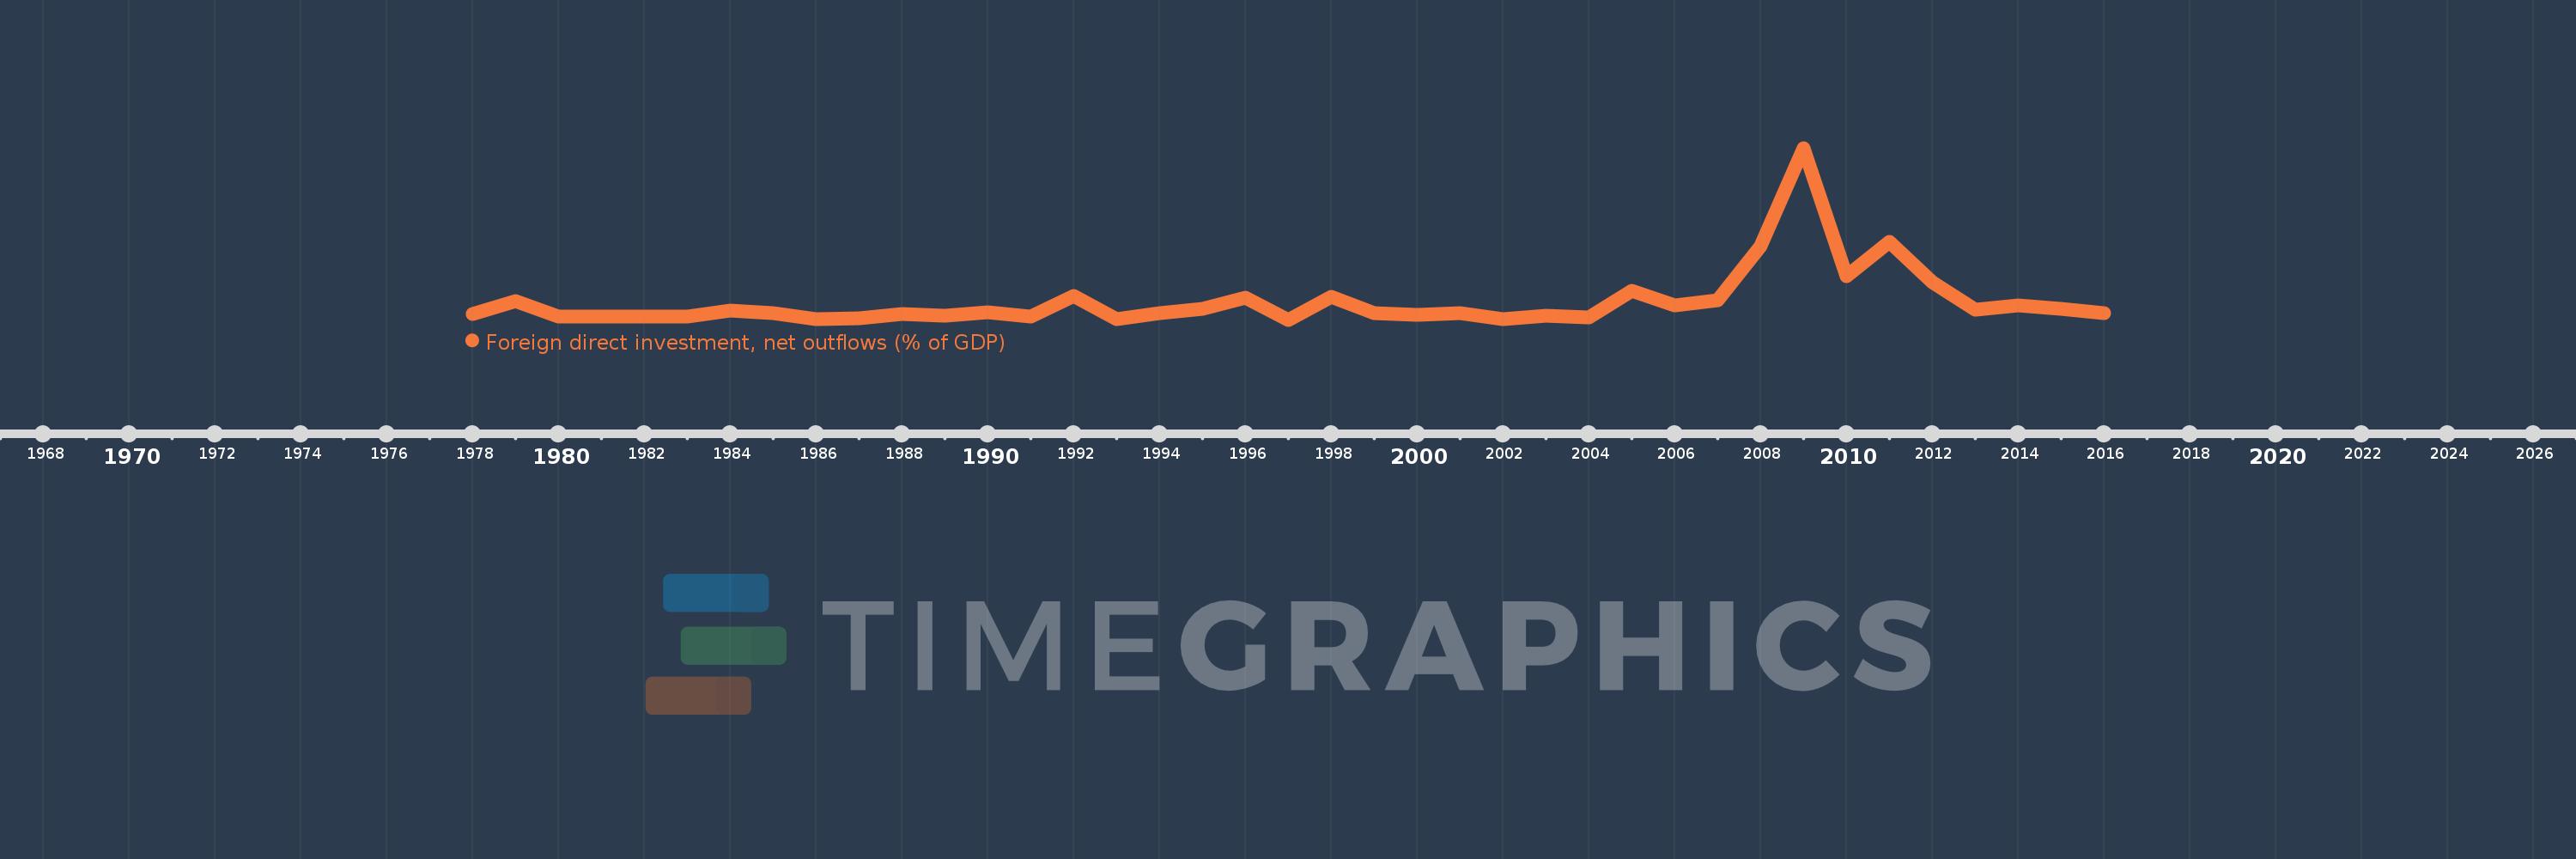
Foreign direct investment, net outflows (% of GDP)
2016,2015,2014,2013,2012,2011,2010,2009,2008,2007,2006,2005,2004,2003,2002,2001,2000,1999,1998,1997,1996,1995,1994,1993,1992,1991,1990,1989,1988,1987,1986,1985,1984,1983,1982,1981,1980,1979,1978
This statistics in other country:
AfghanistanAlbaniaAlgeriaAngolaAntigua and BarbudaArab WorldArgentinaArmeniaArubaAustraliaAustriaAzerbaijanBahamas, TheBahrainBangladeshBarbadosBelarusBelgiumBelizeBeninBermudaBoliviaBosnia and HerzegovinaBotswanaBrazilBrunei DarussalamBulgariaBurkina FasoBurundiCabo VerdeCambodiaCameroonCanadaCaribbean small statesCayman IslandsCentral African RepublicCentral Europe and the BalticsChadChileChinaColombiaComorosCongo, Dem. Rep.Congo, Rep.Costa RicaCote d'IvoireCroatiaCyprusCzech RepublicDenmarkDominicaDominican RepublicEarly-demographic dividendEast Asia & PacificEast Asia & Pacific (excluding high income)East Asia & Pacific (IDA & IBRD countries)EcuadorEgypt, Arab Rep.El SalvadorEquatorial GuineaEritreaEstoniaEuro areaEurope & Central AsiaEurope & Central Asia (excluding high income)Europe & Central Asia (IDA & IBRD countries)European UnionFijiFinlandFragile and conflict affected situationsFranceFrench PolynesiaGabonGambia, TheGeorgiaGermanyGhanaGreeceGrenadaGuatemalaGuineaGuinea-BissauGuyanaHaitiHeavily indebted poor countries (HIPC)High incomeHondurasHong Kong SAR, ChinaHungaryIBRD onlyIcelandIDA & IBRD totalIDA blendIDA onlyIDA totalIndiaIndonesiaIran, Islamic Rep.IraqIrelandIsraelItalyJamaicaJapanJordanKazakhstanKenyaKiribatiKorea, Rep.KosovoKuwaitKyrgyz RepublicLao PDRLate-demographic dividendLatin America & Caribbean Latin America & Caribbean (excluding high income)Latin America & the Caribbean (IDA & IBRD countries)LatviaLeast developed countries: UN classificationLebanonLesothoLiberiaLibyaLithuaniaLow & middle incomeLow incomeLower middle incomeLuxembourgMacao SAR, ChinaMacedonia, FYRMadagascarMalawiMalaysiaMaliMaltaMarshall IslandsMauritaniaMauritiusMexicoMicronesia, Fed. Sts.Middle East & North AfricaMiddle East & North Africa (excluding high income)Middle East & North Africa (IDA & IBRD countries)Middle incomeMoldovaMongoliaMontenegroMoroccoMozambiqueNamibiaNauruNetherlandsNew ZealandNicaraguaNigerNigeriaNorth AmericaNorwayOECD membersOmanOther small statesPacific island small statesPakistanPalauPanamaPapua New GuineaParaguayPeruPhilippinesPolandPortugalPost-demographic dividendPre-demographic dividendQatarRomaniaRussian FederationRwandaSamoaSao Tome and PrincipeSaudi ArabiaSenegalSerbiaSeychellesSierra LeoneSingaporeSlovak RepublicSloveniaSmall statesSolomon IslandsSouth AfricaSouth AsiaSouth Asia (IDA & IBRD)SpainSri LankaSt. Kitts and NevisSt. LuciaSt. Vincent and the GrenadinesSub-Saharan Africa Sub-Saharan Africa (excluding high income)Sub-Saharan Africa (IDA & IBRD countries)SurinameSwazilandSwedenSwitzerlandSyrian Arab RepublicTajikistanTanzaniaThailandTimor-LesteTogoTongaTrinidad and TobagoTunisiaTurkeyUgandaUkraineUnited Arab EmiratesUnited KingdomUnited StatesUpper middle incomeUruguayVanuatuVenezuela, RBVietnamWest Bank and GazaWorldYemen, Rep.ZambiaZimbabwe Timeline:
This timeline shows a graph from 1978 to 2016 of Egypt, Arab Rep.. No data until 1977. Number of actual observations by date: 39.
Source name:
World Development Indicators
Source organization:
International Monetary Fund, International Financial Statistics and Balance of Payments databases, World Bank, International Debt Statistics, and World Bank and OECD GDP estimates.
Categories, topics:
Economy & Growth, Financial Sector
Last updated:
apr 23, 2017
Indicators value changes by year
At the date of observation
Value
Absolute change
Change from previous value
jan 1, 1978
0.049
+0.049
0.0%
jan 1, 1979
0.133
+0.084
171.04%
jan 1, 1980
0.028
-0.104
-78.62%
jan 1, 1981
0.031
+0.002
7.82%
jan 1, 1982
0.026
-0.005
-16.09%
jan 1, 1983
0.031
+0.006
21.94%
jan 1, 1984
0.068
+0.036
116.02%
jan 1, 1985
0.052
-0.015
-22.67%
jan 1, 1986
0.009
-0.044
-83.44%
jan 1, 1987
0.017
+0.008
93.36%
jan 1, 1988
0.047
+0.03
180.49%
jan 1, 1989
0.034
-0.013
-27.0%
jan 1, 1990
0.057
+0.023
66.73%
jan 1, 1991
0.028
-0.029
-51.27%
jan 1, 1992
0.168
+0.14
502.75%
jan 1, 1993
0.01
-0.158
-94.3%
jan 1, 1994
0.054
+0.044
461.63%
jan 1, 1995
0.083
+0.029
54.37%
jan 1, 1996
0.155
+0.072
86.58%
jan 1, 1997
0.007
-0.147
-95.22%
jan 1, 1998
0.165
+0.157
2.13K%
jan 1, 1999
0.053
-0.112
-67.79%
jan 1, 2000
0.041
-0.012
-22.07%
jan 1, 2001
0.051
+0.01
23.57%
jan 1, 2002
0.013
-0.038
-75.14%
jan 1, 2003
0.032
+0.019
149.16%
jan 1, 2004
0.025
-0.007
-21.12%
jan 1, 2005
0.202
+0.177
707.35%
jan 1, 2006
0.103
-0.099
-49.1%
jan 1, 2007
0.138
+0.035
34.59%
jan 1, 2008
0.51
+0.371
269.03%
jan 1, 2009
1.179
+0.67
131.47%
jan 1, 2010
0.302
-0.877
-74.37%
jan 1, 2011
0.537
+0.235
77.68%
jan 1, 2012
0.265
-0.272
-50.65%
jan 1, 2013
0.076
-0.189
-71.18%
jan 1, 2014
0.105
+0.029
37.77%
jan 1, 2015
0.084
-0.021
-20.36%
jan 1, 2016
0.055
-0.029
-34.46%
Ranking of countries by current statistics by years


Comments: