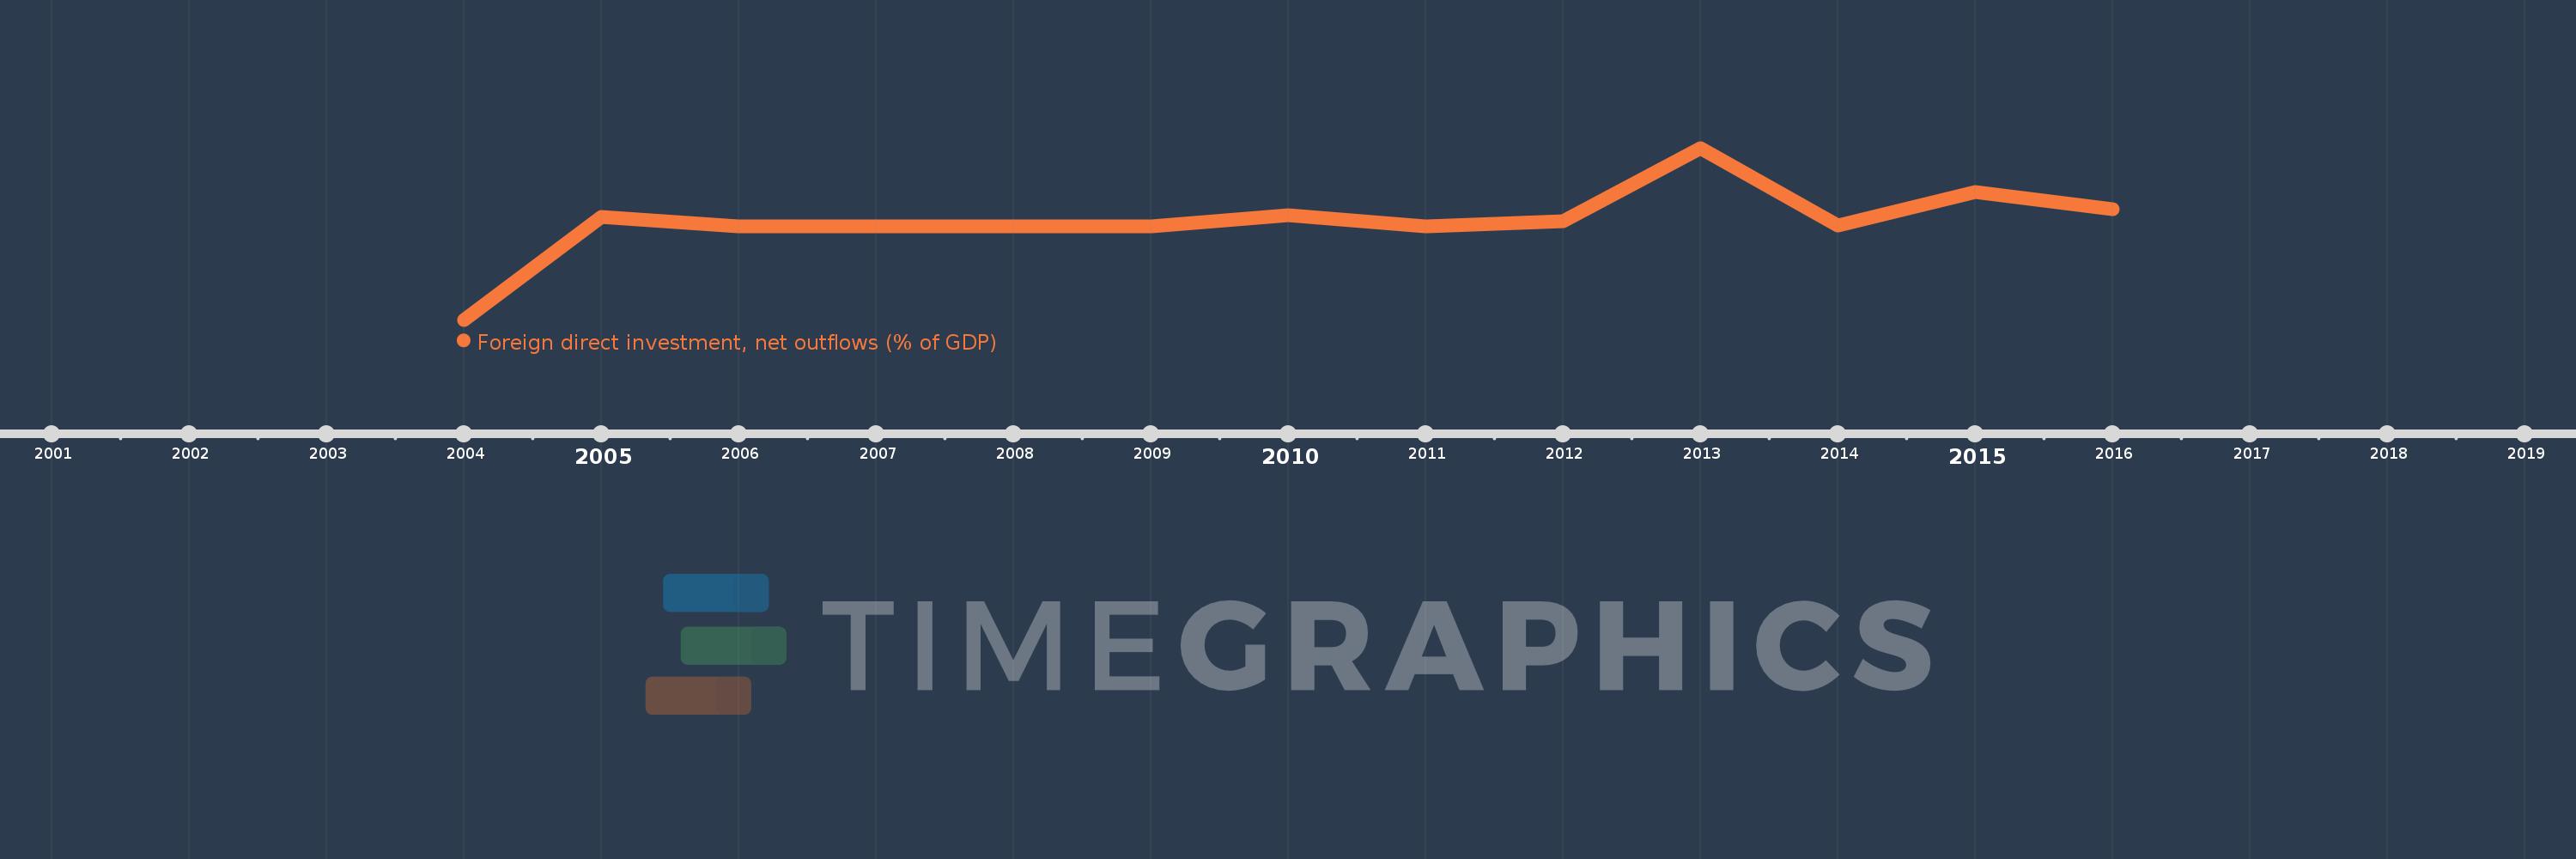
This timeline shows a graph from 2004 to 2016 of Samoa. No data until 2003. Number of actual observations by date: 13.
Source name:
World Development Indicators
Source organization:
International Monetary Fund, International Financial Statistics and Balance of Payments databases, World Bank, International Debt Statistics, and World Bank and OECD GDP estimates.
Categories, topics:
Economy & Growth, Financial Sector
Last updated:
apr 23, 2017
Indicators value changes by year
Meaning:
0.074
Minimum:
-1.489
jan 1, 2004
Maximum:
1.244
jan 1, 2013
At the date of observation
Value
Absolute change
Change from the previous value
jan 1, 2004
-1.489
-1.489
0.0%
jan 1, 2005
0.144
+1.633
-109.68%
jan 1, 2006
0.0
-0.144
-100.0%
jan 1, 2007
0.0
0.0
%
jan 1, 2008
0.0
0.0
%
jan 1, 2009
0.0
0.0
%
jan 1, 2010
0.17
+0.17
%
jan 1, 2011
0.0
-0.17
-100.0%
jan 1, 2012
0.079
+0.079
%
jan 1, 2013
1.244
+1.165
1.48K%
jan 1, 2014
0.012
-1.231
-99.0%
jan 1, 2015
0.541
+0.528
4.26K%
jan 1, 2016
0.264
-0.276
-51.1%
Ranking of countries by current statistics by years
