29
/
en
AIzaSyAYiBZKx7MnpbEhh9jyipgxe19OcubqV5w
April 1, 2024
107230
Colombia
COL
true
2
1
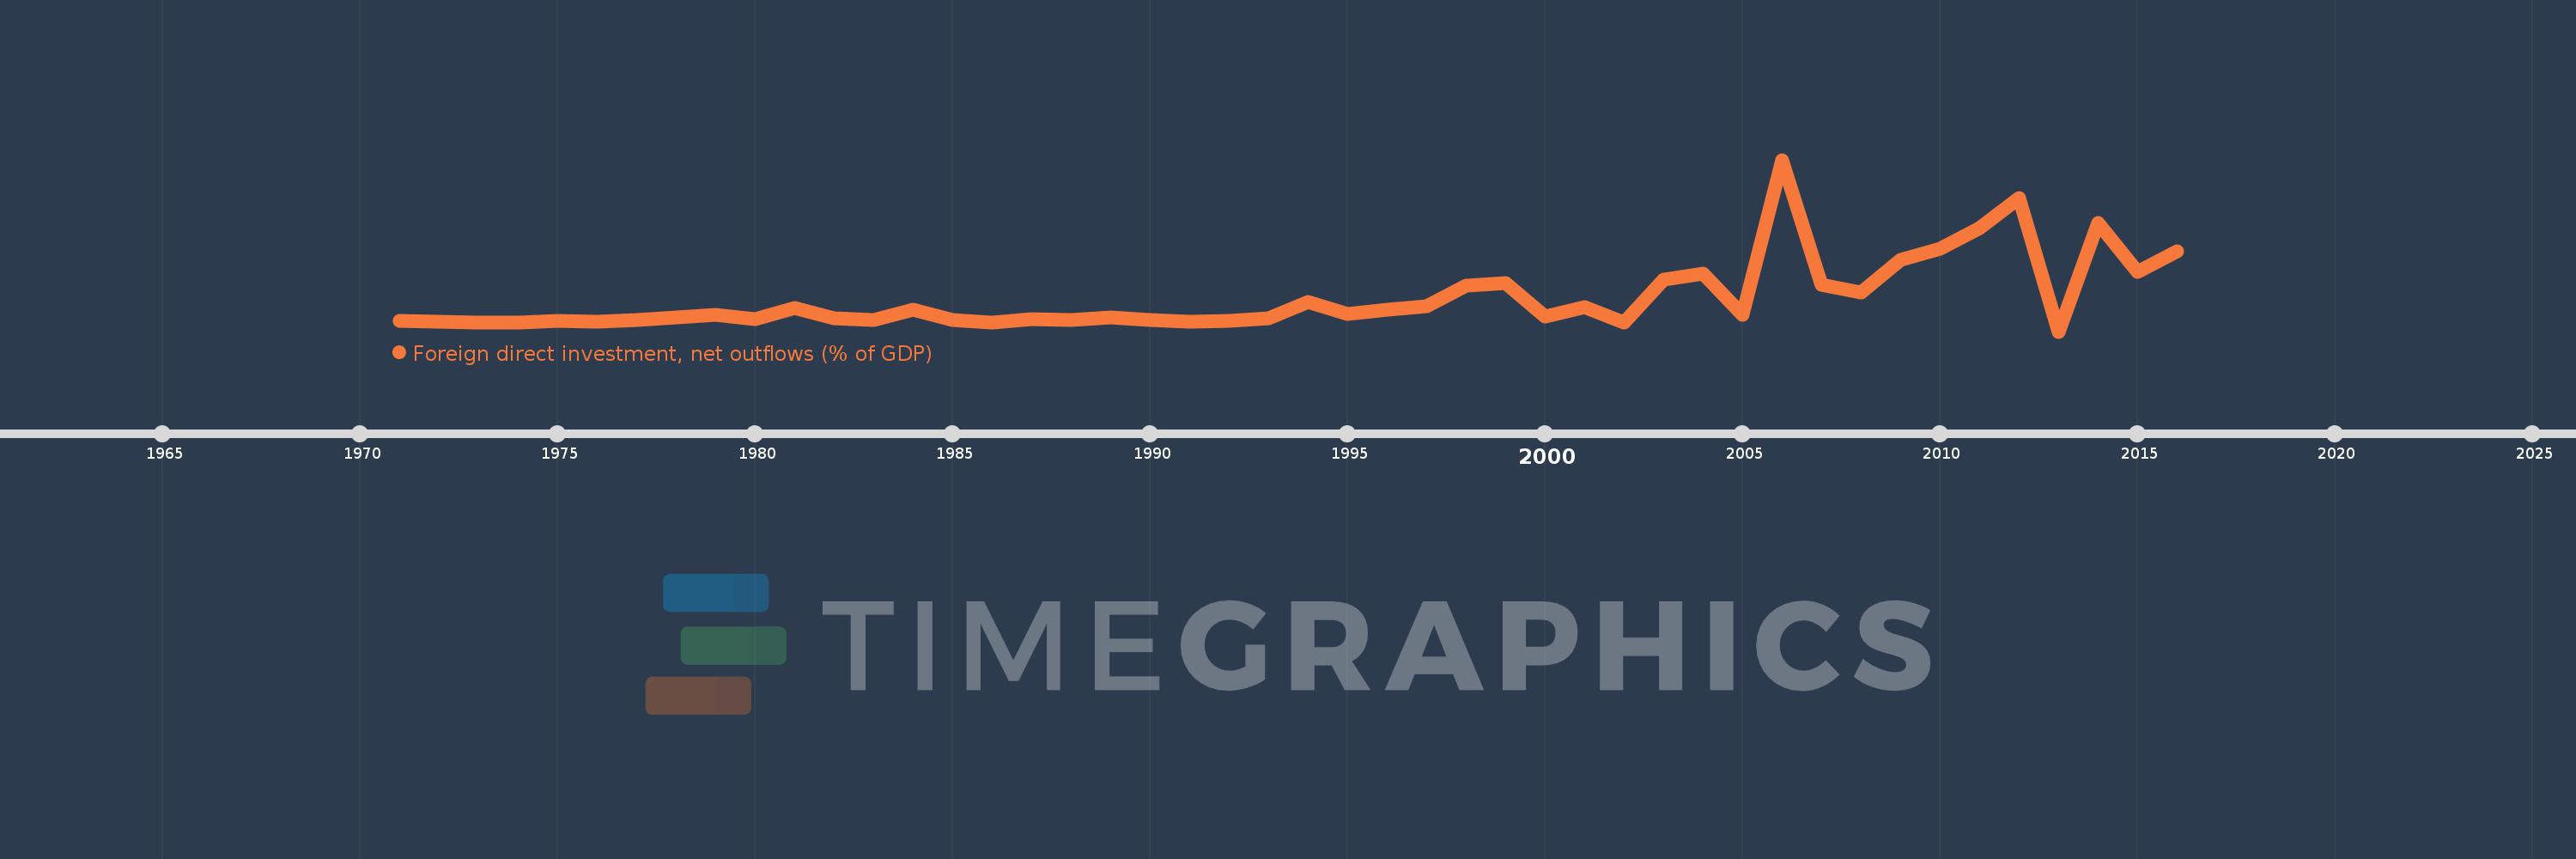
Foreign direct investment, net outflows (% of GDP)
2016,2015,2014,2013,2012,2011,2010,2009,2008,2007,2006,2005,2004,2003,2002,2001,2000,1999,1998,1997,1996,1995,1994,1993,1992,1991,1990,1989,1988,1987,1986,1985,1984,1983,1982,1981,1980,1979,1978,1977,1976,1975,1974,1973,1972,1971
This statistics in other country:
AfghanistanAlbaniaAlgeriaAngolaAntigua and BarbudaArab WorldArgentinaArmeniaArubaAustraliaAustriaAzerbaijanBahamas, TheBahrainBangladeshBarbadosBelarusBelgiumBelizeBeninBermudaBoliviaBosnia and HerzegovinaBotswanaBrazilBrunei DarussalamBulgariaBurkina FasoBurundiCabo VerdeCambodiaCameroonCanadaCaribbean small statesCayman IslandsCentral African RepublicCentral Europe and the BalticsChadChileChinaColombiaComorosCongo, Dem. Rep.Congo, Rep.Costa RicaCote d'IvoireCroatiaCyprusCzech RepublicDenmarkDominicaDominican RepublicEarly-demographic dividendEast Asia & PacificEast Asia & Pacific (excluding high income)East Asia & Pacific (IDA & IBRD countries)EcuadorEgypt, Arab Rep.El SalvadorEquatorial GuineaEritreaEstoniaEuro areaEurope & Central AsiaEurope & Central Asia (excluding high income)Europe & Central Asia (IDA & IBRD countries)European UnionFijiFinlandFragile and conflict affected situationsFranceFrench PolynesiaGabonGambia, TheGeorgiaGermanyGhanaGreeceGrenadaGuatemalaGuineaGuinea-BissauGuyanaHaitiHeavily indebted poor countries (HIPC)High incomeHondurasHong Kong SAR, ChinaHungaryIBRD onlyIcelandIDA & IBRD totalIDA blendIDA onlyIDA totalIndiaIndonesiaIran, Islamic Rep.IraqIrelandIsraelItalyJamaicaJapanJordanKazakhstanKenyaKiribatiKorea, Rep.KosovoKuwaitKyrgyz RepublicLao PDRLate-demographic dividendLatin America & Caribbean Latin America & Caribbean (excluding high income)Latin America & the Caribbean (IDA & IBRD countries)LatviaLeast developed countries: UN classificationLebanonLesothoLiberiaLibyaLithuaniaLow & middle incomeLow incomeLower middle incomeLuxembourgMacao SAR, ChinaMacedonia, FYRMadagascarMalawiMalaysiaMaliMaltaMarshall IslandsMauritaniaMauritiusMexicoMicronesia, Fed. Sts.Middle East & North AfricaMiddle East & North Africa (excluding high income)Middle East & North Africa (IDA & IBRD countries)Middle incomeMoldovaMongoliaMontenegroMoroccoMozambiqueNamibiaNauruNetherlandsNew ZealandNicaraguaNigerNigeriaNorth AmericaNorwayOECD membersOmanOther small statesPacific island small statesPakistanPalauPanamaPapua New GuineaParaguayPeruPhilippinesPolandPortugalPost-demographic dividendPre-demographic dividendQatarRomaniaRussian FederationRwandaSamoaSao Tome and PrincipeSaudi ArabiaSenegalSerbiaSeychellesSierra LeoneSingaporeSlovak RepublicSloveniaSmall statesSolomon IslandsSouth AfricaSouth AsiaSouth Asia (IDA & IBRD)SpainSri LankaSt. Kitts and NevisSt. LuciaSt. Vincent and the GrenadinesSub-Saharan Africa Sub-Saharan Africa (excluding high income)Sub-Saharan Africa (IDA & IBRD countries)SurinameSwazilandSwedenSwitzerlandSyrian Arab RepublicTajikistanTanzaniaThailandTimor-LesteTogoTongaTrinidad and TobagoTunisiaTurkeyUgandaUkraineUnited Arab EmiratesUnited KingdomUnited StatesUpper middle incomeUruguayVanuatuVenezuela, RBVietnamWest Bank and GazaWorldYemen, Rep.ZambiaZimbabwe Timeline:
This timeline shows a graph from 1971 to 2016 of Colombia. No data until 1970. Number of actual observations by date: 46.
Source name:
World Development Indicators
Source organization:
International Monetary Fund, International Financial Statistics and Balance of Payments databases, World Bank, International Debt Statistics, and World Bank and OECD GDP estimates.
Categories, topics:
Economy & Growth, Financial Sector
Last updated:
apr 23, 2017
Indicators value changes by year
Minimum:
-0.164
jan 1, 2013
At the date of observation
Value
Absolute change
Change from previous value
jan 1, 1971
0.056
+0.056
0.0%
jan 1, 1972
0.038
-0.017
-30.76%
jan 1, 1973
0.013
-0.026
-67.46%
jan 1, 1974
0.012
-0.001
-7.7%
jan 1, 1975
0.049
+0.037
320.64%
jan 1, 1976
0.031
-0.018
-37.18%
jan 1, 1977
0.072
+0.041
134.8%
jan 1, 1978
0.113
+0.041
57.58%
jan 1, 1979
0.176
+0.063
55.98%
jan 1, 1980
0.086
-0.09
-51.26%
jan 1, 1981
0.317
+0.231
269.46%
jan 1, 1982
0.102
-0.216
-67.96%
jan 1, 1983
0.074
-0.027
-26.81%
jan 1, 1984
0.269
+0.195
261.79%
jan 1, 1985
0.06
-0.209
-77.67%
jan 1, 1986
0.02
-0.04
-66.64%
jan 1, 1987
0.092
+0.072
356.51%
jan 1, 1988
0.071
-0.02
-21.95%
jan 1, 1989
0.112
+0.041
56.98%
jan 1, 1990
0.073
-0.039
-34.64%
jan 1, 1991
0.04
-0.034
-45.83%
jan 1, 1992
0.059
+0.019
48.32%
jan 1, 1993
0.101
+0.043
72.19%
jan 1, 1994
0.43
+0.329
323.89%
jan 1, 1995
0.182
-0.248
-57.61%
jan 1, 1996
0.277
+0.095
51.9%
jan 1, 1997
0.338
+0.061
21.87%
jan 1, 1998
0.759
+0.421
124.84%
jan 1, 1999
0.809
+0.05
6.55%
jan 1, 2000
0.134
-0.675
-83.42%
jan 1, 2001
0.326
+0.192
142.97%
jan 1, 2002
0.016
-0.309
-94.96%
jan 1, 2003
0.875
+0.858
5.23K%
jan 1, 2004
0.99
+0.115
13.2%
jan 1, 2005
0.164
-0.826
-83.4%
jan 1, 2006
3.272
+3.108
1.89K%
jan 1, 2007
0.78
-2.492
-76.17%
jan 1, 2008
0.617
-0.163
-20.93%
jan 1, 2009
1.264
+0.648
105.1%
jan 1, 2010
1.499
+0.234
18.54%
jan 1, 2011
1.91
+0.411
27.44%
jan 1, 2012
2.51
+0.6
31.41%
jan 1, 2013
-0.164
-2.674
-106.53%
jan 1, 2014
2.013
+2.177
-1.33K%
jan 1, 2015
1.03
-0.982
-48.81%
jan 1, 2016
1.444
+0.414
40.15%
Ranking of countries by current statistics by years


Comments: