29
/
en
AIzaSyAYiBZKx7MnpbEhh9jyipgxe19OcubqV5w
April 1, 2024
72956
Australia
AUS
true
2
1
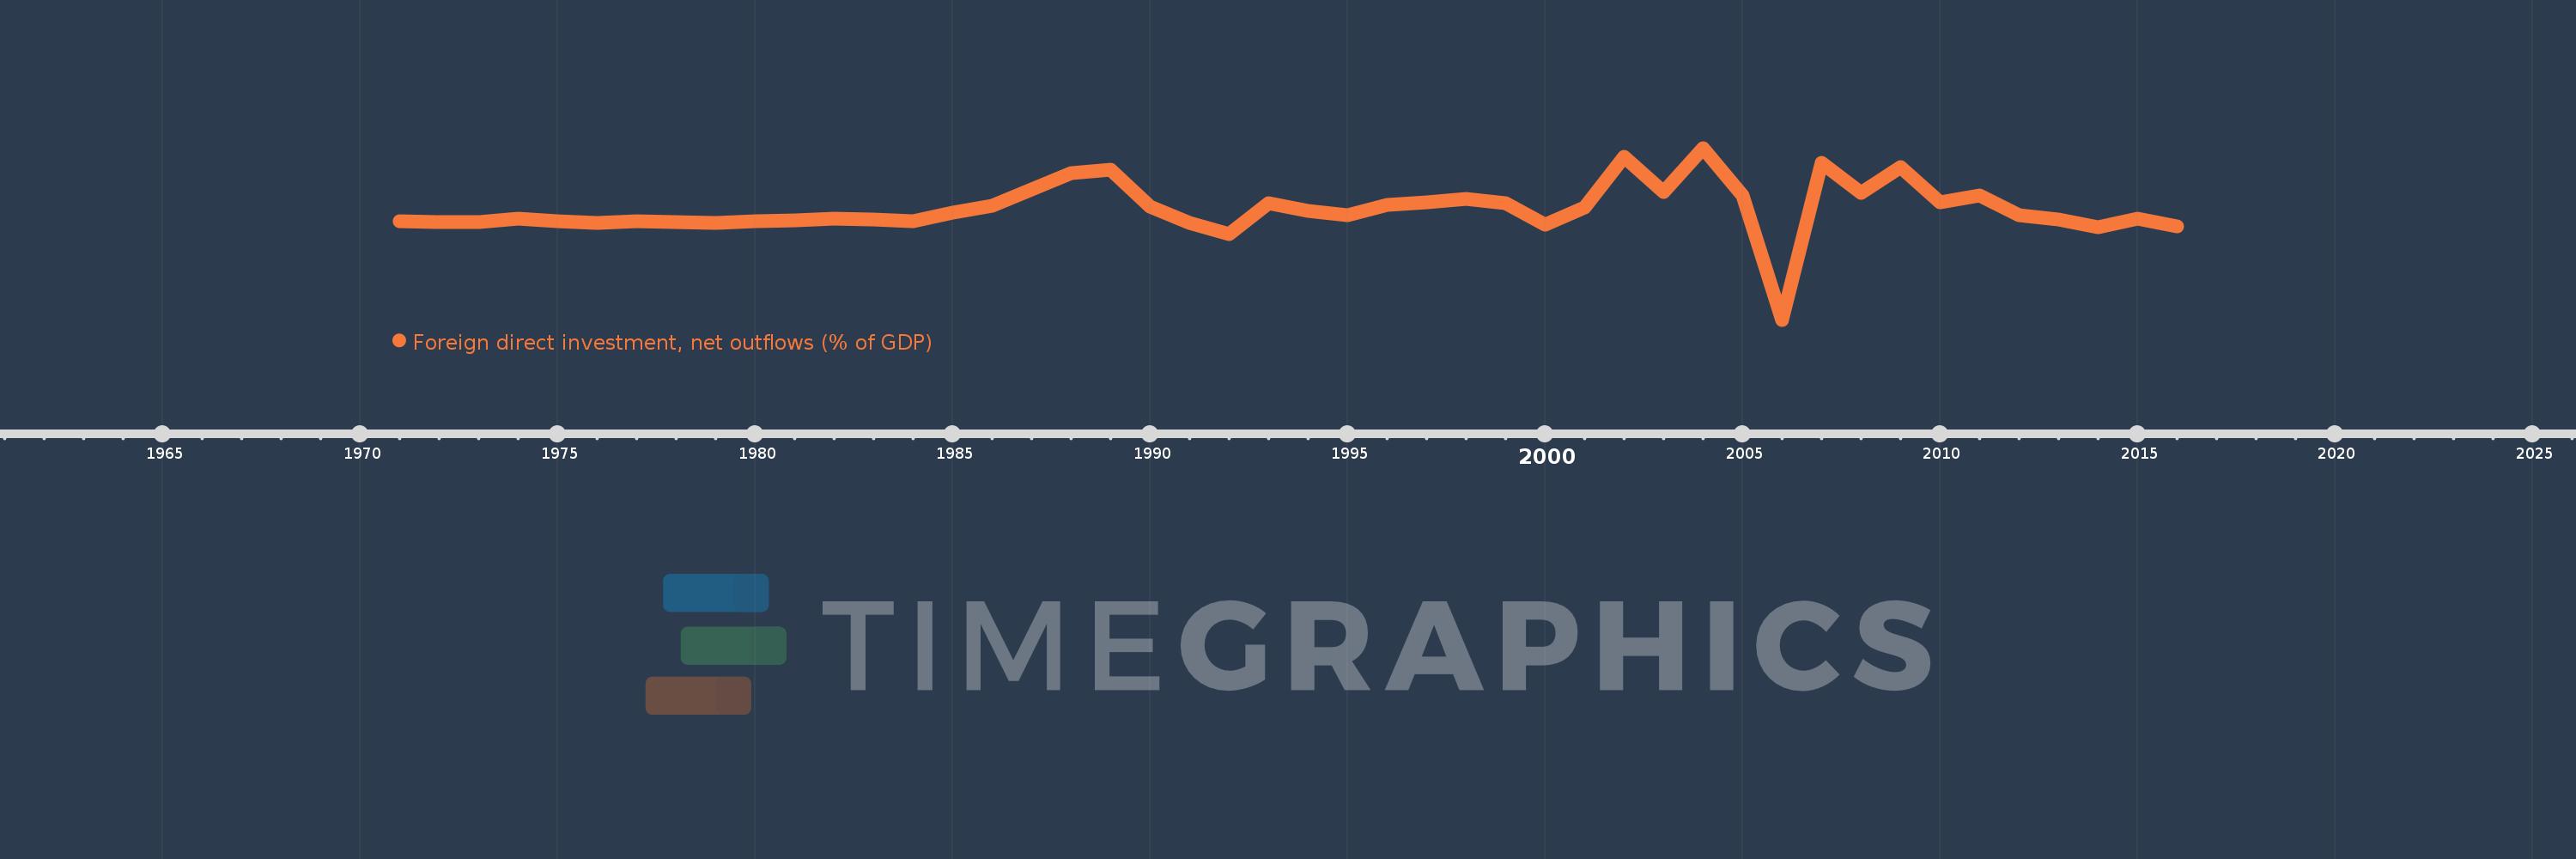
Foreign direct investment, net outflows (% of GDP)
2016,2015,2014,2013,2012,2011,2010,2009,2008,2007,2006,2005,2004,2003,2002,2001,2000,1999,1998,1997,1996,1995,1994,1993,1992,1991,1990,1989,1988,1987,1986,1985,1984,1983,1982,1981,1980,1979,1978,1977,1976,1975,1974,1973,1972,1971
This statistics in other country:
AfghanistanAlbaniaAlgeriaAngolaAntigua and BarbudaArab WorldArgentinaArmeniaArubaAustraliaAustriaAzerbaijanBahamas, TheBahrainBangladeshBarbadosBelarusBelgiumBelizeBeninBermudaBoliviaBosnia and HerzegovinaBotswanaBrazilBrunei DarussalamBulgariaBurkina FasoBurundiCabo VerdeCambodiaCameroonCanadaCaribbean small statesCayman IslandsCentral African RepublicCentral Europe and the BalticsChadChileChinaColombiaComorosCongo, Dem. Rep.Congo, Rep.Costa RicaCote d'IvoireCroatiaCyprusCzech RepublicDenmarkDominicaDominican RepublicEarly-demographic dividendEast Asia & PacificEast Asia & Pacific (excluding high income)East Asia & Pacific (IDA & IBRD countries)EcuadorEgypt, Arab Rep.El SalvadorEquatorial GuineaEritreaEstoniaEuro areaEurope & Central AsiaEurope & Central Asia (excluding high income)Europe & Central Asia (IDA & IBRD countries)European UnionFijiFinlandFragile and conflict affected situationsFranceFrench PolynesiaGabonGambia, TheGeorgiaGermanyGhanaGreeceGrenadaGuatemalaGuineaGuinea-BissauGuyanaHaitiHeavily indebted poor countries (HIPC)High incomeHondurasHong Kong SAR, ChinaHungaryIBRD onlyIcelandIDA & IBRD totalIDA blendIDA onlyIDA totalIndiaIndonesiaIran, Islamic Rep.IraqIrelandIsraelItalyJamaicaJapanJordanKazakhstanKenyaKiribatiKorea, Rep.KosovoKuwaitKyrgyz RepublicLao PDRLate-demographic dividendLatin America & Caribbean Latin America & Caribbean (excluding high income)Latin America & the Caribbean (IDA & IBRD countries)LatviaLeast developed countries: UN classificationLebanonLesothoLiberiaLibyaLithuaniaLow & middle incomeLow incomeLower middle incomeLuxembourgMacao SAR, ChinaMacedonia, FYRMadagascarMalawiMalaysiaMaliMaltaMarshall IslandsMauritaniaMauritiusMexicoMicronesia, Fed. Sts.Middle East & North AfricaMiddle East & North Africa (excluding high income)Middle East & North Africa (IDA & IBRD countries)Middle incomeMoldovaMongoliaMontenegroMoroccoMozambiqueNamibiaNauruNetherlandsNew ZealandNicaraguaNigerNigeriaNorth AmericaNorwayOECD membersOmanOther small statesPacific island small statesPakistanPalauPanamaPapua New GuineaParaguayPeruPhilippinesPolandPortugalPost-demographic dividendPre-demographic dividendQatarRomaniaRussian FederationRwandaSamoaSao Tome and PrincipeSaudi ArabiaSenegalSerbiaSeychellesSierra LeoneSingaporeSlovak RepublicSloveniaSmall statesSolomon IslandsSouth AfricaSouth AsiaSouth Asia (IDA & IBRD)SpainSri LankaSt. Kitts and NevisSt. LuciaSt. Vincent and the GrenadinesSub-Saharan Africa Sub-Saharan Africa (excluding high income)Sub-Saharan Africa (IDA & IBRD countries)SurinameSwazilandSwedenSwitzerlandSyrian Arab RepublicTajikistanTanzaniaThailandTimor-LesteTogoTongaTrinidad and TobagoTunisiaTurkeyUgandaUkraineUnited Arab EmiratesUnited KingdomUnited StatesUpper middle incomeUruguayVanuatuVenezuela, RBVietnamWest Bank and GazaWorldYemen, Rep.ZambiaZimbabwe Timeline:
This timeline shows a graph from 1971 to 2016 of Australia. No data until 1970. Number of actual observations by date: 46.
Source name:
World Development Indicators
Source organization:
International Monetary Fund, International Financial Statistics and Balance of Payments databases, World Bank, International Debt Statistics, and World Bank and OECD GDP estimates.
Categories, topics:
Economy & Growth, Financial Sector
Last updated:
apr 23, 2017
Indicators value changes by year
At the date of observation
Value
Absolute change
Change from previous value
jan 1, 1971
0.27
+0.27
0.0%
jan 1, 1972
0.232
-0.038
-14.22%
jan 1, 1973
0.248
+0.016
7.07%
jan 1, 1974
0.402
+0.154
62.01%
jan 1, 1975
0.271
-0.13
-32.46%
jan 1, 1976
0.166
-0.105
-38.87%
jan 1, 1977
0.255
+0.089
53.95%
jan 1, 1978
0.242
-0.014
-5.33%
jan 1, 1979
0.199
-0.042
-17.49%
jan 1, 1980
0.255
+0.056
27.84%
jan 1, 1981
0.307
+0.052
20.55%
jan 1, 1982
0.415
+0.108
35.12%
jan 1, 1983
0.358
-0.058
-13.86%
jan 1, 1984
0.293
-0.065
-18.15%
jan 1, 1985
0.726
+0.433
148.03%
jan 1, 1986
1.047
+0.321
44.14%
jan 1, 1987
1.878
+0.832
79.43%
jan 1, 1988
2.697
+0.819
43.58%
jan 1, 1989
2.904
+0.207
7.66%
jan 1, 1990
1.01
-1.894
-65.22%
jan 1, 1991
0.204
-0.806
-79.84%
jan 1, 1992
-0.36
-0.564
-276.82%
jan 1, 1993
1.179
+1.539
-427.56%
jan 1, 1994
0.816
-0.363
-30.79%
jan 1, 1995
0.566
-0.25
-30.62%
jan 1, 1996
1.1
+0.533
94.18%
jan 1, 1997
1.247
+0.148
13.45%
jan 1, 1998
1.396
+0.149
11.94%
jan 1, 1999
1.169
-0.228
-16.3%
jan 1, 2000
0.08
-1.089
-93.15%
jan 1, 2001
0.987
+0.907
1.13K%
jan 1, 2002
3.536
+2.549
258.27%
jan 1, 2003
1.769
-1.766
-49.96%
jan 1, 2004
3.988
+2.219
125.4%
jan 1, 2005
1.597
-2.391
-59.95%
jan 1, 2006
-4.72
-6.317
-395.55%
jan 1, 2007
3.224
+7.944
-168.31%
jan 1, 2008
1.69
-1.534
-47.57%
jan 1, 2009
3.024
+1.333
78.87%
jan 1, 2010
1.237
-1.787
-59.08%
jan 1, 2011
1.582
+0.345
27.85%
jan 1, 2012
0.594
-0.988
-62.47%
jan 1, 2013
0.375
-0.219
-36.85%
jan 1, 2014
-0.049
-0.424
-113.13%
jan 1, 2015
0.389
+0.439
-891.24%
jan 1, 2016
0.03
-0.36
-92.35%
Ranking of countries by current statistics by years


Comments: