29
/
en
AIzaSyAYiBZKx7MnpbEhh9jyipgxe19OcubqV5w
April 1, 2024
118893
Denmark
DNK
true
2
1
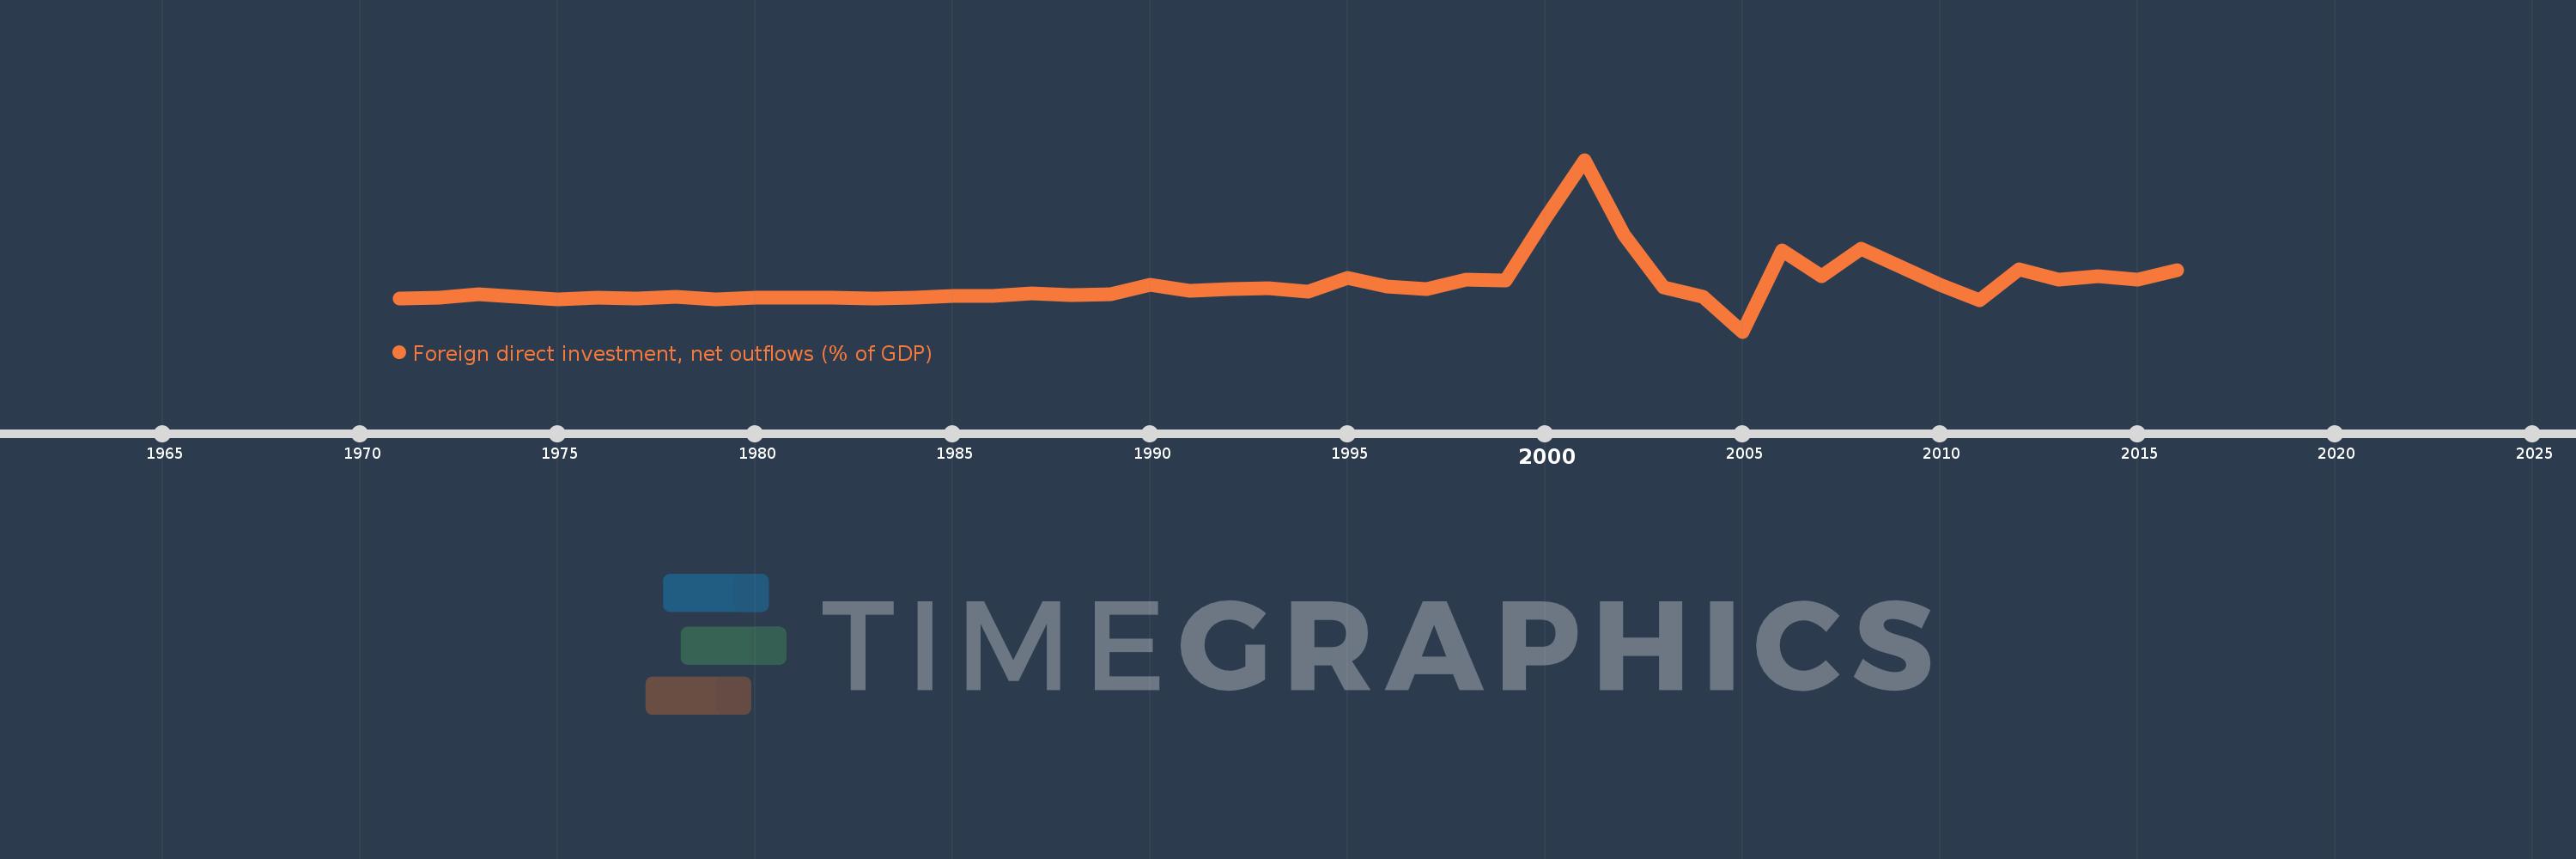
Foreign direct investment, net outflows (% of GDP)
2016,2015,2014,2013,2012,2011,2010,2009,2008,2007,2006,2005,2004,2003,2002,2001,2000,1999,1998,1997,1996,1995,1994,1993,1992,1991,1990,1989,1988,1987,1986,1985,1984,1983,1982,1981,1980,1979,1978,1977,1976,1975,1974,1973,1972,1971
This statistics in other country:
AfghanistanAlbaniaAlgeriaAngolaAntigua and BarbudaArab WorldArgentinaArmeniaArubaAustraliaAustriaAzerbaijanBahamas, TheBahrainBangladeshBarbadosBelarusBelgiumBelizeBeninBermudaBoliviaBosnia and HerzegovinaBotswanaBrazilBrunei DarussalamBulgariaBurkina FasoBurundiCabo VerdeCambodiaCameroonCanadaCaribbean small statesCayman IslandsCentral African RepublicCentral Europe and the BalticsChadChileChinaColombiaComorosCongo, Dem. Rep.Congo, Rep.Costa RicaCote d'IvoireCroatiaCyprusCzech RepublicDenmarkDominicaDominican RepublicEarly-demographic dividendEast Asia & PacificEast Asia & Pacific (excluding high income)East Asia & Pacific (IDA & IBRD countries)EcuadorEgypt, Arab Rep.El SalvadorEquatorial GuineaEritreaEstoniaEuro areaEurope & Central AsiaEurope & Central Asia (excluding high income)Europe & Central Asia (IDA & IBRD countries)European UnionFijiFinlandFragile and conflict affected situationsFranceFrench PolynesiaGabonGambia, TheGeorgiaGermanyGhanaGreeceGrenadaGuatemalaGuineaGuinea-BissauGuyanaHaitiHeavily indebted poor countries (HIPC)High incomeHondurasHong Kong SAR, ChinaHungaryIBRD onlyIcelandIDA & IBRD totalIDA blendIDA onlyIDA totalIndiaIndonesiaIran, Islamic Rep.IraqIrelandIsraelItalyJamaicaJapanJordanKazakhstanKenyaKiribatiKorea, Rep.KosovoKuwaitKyrgyz RepublicLao PDRLate-demographic dividendLatin America & Caribbean Latin America & Caribbean (excluding high income)Latin America & the Caribbean (IDA & IBRD countries)LatviaLeast developed countries: UN classificationLebanonLesothoLiberiaLibyaLithuaniaLow & middle incomeLow incomeLower middle incomeLuxembourgMacao SAR, ChinaMacedonia, FYRMadagascarMalawiMalaysiaMaliMaltaMarshall IslandsMauritaniaMauritiusMexicoMicronesia, Fed. Sts.Middle East & North AfricaMiddle East & North Africa (excluding high income)Middle East & North Africa (IDA & IBRD countries)Middle incomeMoldovaMongoliaMontenegroMoroccoMozambiqueNamibiaNauruNetherlandsNew ZealandNicaraguaNigerNigeriaNorth AmericaNorwayOECD membersOmanOther small statesPacific island small statesPakistanPalauPanamaPapua New GuineaParaguayPeruPhilippinesPolandPortugalPost-demographic dividendPre-demographic dividendQatarRomaniaRussian FederationRwandaSamoaSao Tome and PrincipeSaudi ArabiaSenegalSerbiaSeychellesSierra LeoneSingaporeSlovak RepublicSloveniaSmall statesSolomon IslandsSouth AfricaSouth AsiaSouth Asia (IDA & IBRD)SpainSri LankaSt. Kitts and NevisSt. LuciaSt. Vincent and the GrenadinesSub-Saharan Africa Sub-Saharan Africa (excluding high income)Sub-Saharan Africa (IDA & IBRD countries)SurinameSwazilandSwedenSwitzerlandSyrian Arab RepublicTajikistanTanzaniaThailandTimor-LesteTogoTongaTrinidad and TobagoTunisiaTurkeyUgandaUkraineUnited Arab EmiratesUnited KingdomUnited StatesUpper middle incomeUruguayVanuatuVenezuela, RBVietnamWest Bank and GazaWorldYemen, Rep.ZambiaZimbabwe Timeline:
This timeline shows a graph from 1971 to 2016 of Denmark. No data until 1970. Number of actual observations by date: 46.
Source name:
World Development Indicators
Source organization:
International Monetary Fund, International Financial Statistics and Balance of Payments databases, World Bank, International Debt Statistics, and World Bank and OECD GDP estimates.
Categories, topics:
Economy & Growth, Financial Sector
Last updated:
apr 23, 2017
Indicators value changes by year
Minimum:
-3.952
jan 1, 2005
Maximum:
17.289
jan 1, 2001
At the date of observation
Value
Absolute change
Change from previous value
jan 1, 1971
0.172
+0.172
0.0%
jan 1, 1972
0.276
+0.104
60.67%
jan 1, 1973
0.644
+0.368
133.27%
jan 1, 1974
0.322
-0.323
-50.07%
jan 1, 1975
0.024
-0.298
-92.67%
jan 1, 1976
0.196
+0.172
729.72%
jan 1, 1977
0.143
-0.053
-26.91%
jan 1, 1978
0.325
+0.182
126.9%
jan 1, 1979
0.055
-0.27
-83.03%
jan 1, 1980
0.238
+0.183
331.94%
jan 1, 1981
0.276
+0.038
15.98%
jan 1, 1982
0.226
-0.05
-18.09%
jan 1, 1983
0.136
-0.09
-39.68%
jan 1, 1984
0.249
+0.113
82.87%
jan 1, 1985
0.492
+0.243
97.39%
jan 1, 1986
0.492
+0.0
0.04%
jan 1, 1987
0.745
+0.253
51.35%
jan 1, 1988
0.567
-0.179
-23.96%
jan 1, 1989
0.626
+0.059
10.43%
jan 1, 1990
1.846
+1.22
194.99%
jan 1, 1991
1.073
-0.773
-41.87%
jan 1, 1992
1.333
+0.259
24.16%
jan 1, 1993
1.464
+0.132
9.88%
jan 1, 1994
0.96
-0.504
-34.42%
jan 1, 1995
2.665
+1.705
177.53%
jan 1, 1996
1.605
-1.061
-39.8%
jan 1, 1997
1.338
-0.267
-16.62%
jan 1, 1998
2.509
+1.171
87.56%
jan 1, 1999
2.381
-0.128
-5.11%
jan 1, 2000
10.013
+7.631
320.48%
jan 1, 2001
17.289
+7.276
72.67%
jan 1, 2002
7.982
-9.307
-53.83%
jan 1, 2003
1.483
-6.499
-81.42%
jan 1, 2004
0.393
-1.091
-73.53%
jan 1, 2005
-3.952
-4.345
-1.11K%
jan 1, 2006
6.126
+10.078
-254.99%
jan 1, 2007
2.879
-3.247
-53.0%
jan 1, 2008
6.258
+3.379
117.39%
jan 1, 2009
4.063
-2.196
-35.08%
jan 1, 2010
1.833
-2.23
-54.88%
jan 1, 2011
-0.083
-1.916
-104.54%
jan 1, 2012
3.747
+3.83
-4.6K%
jan 1, 2013
2.45
-1.296
-34.6%
jan 1, 2014
2.881
+0.43
17.55%
jan 1, 2015
2.427
-0.453
-15.73%
jan 1, 2016
3.691
+1.264
52.07%
Ranking of countries by current statistics by years


Comments: