29
/
en
AIzaSyAYiBZKx7MnpbEhh9jyipgxe19OcubqV5w
April 1, 2024
43414
Latin America & the Caribbean (IDA & IBRD countries)
TLA
false
2
1
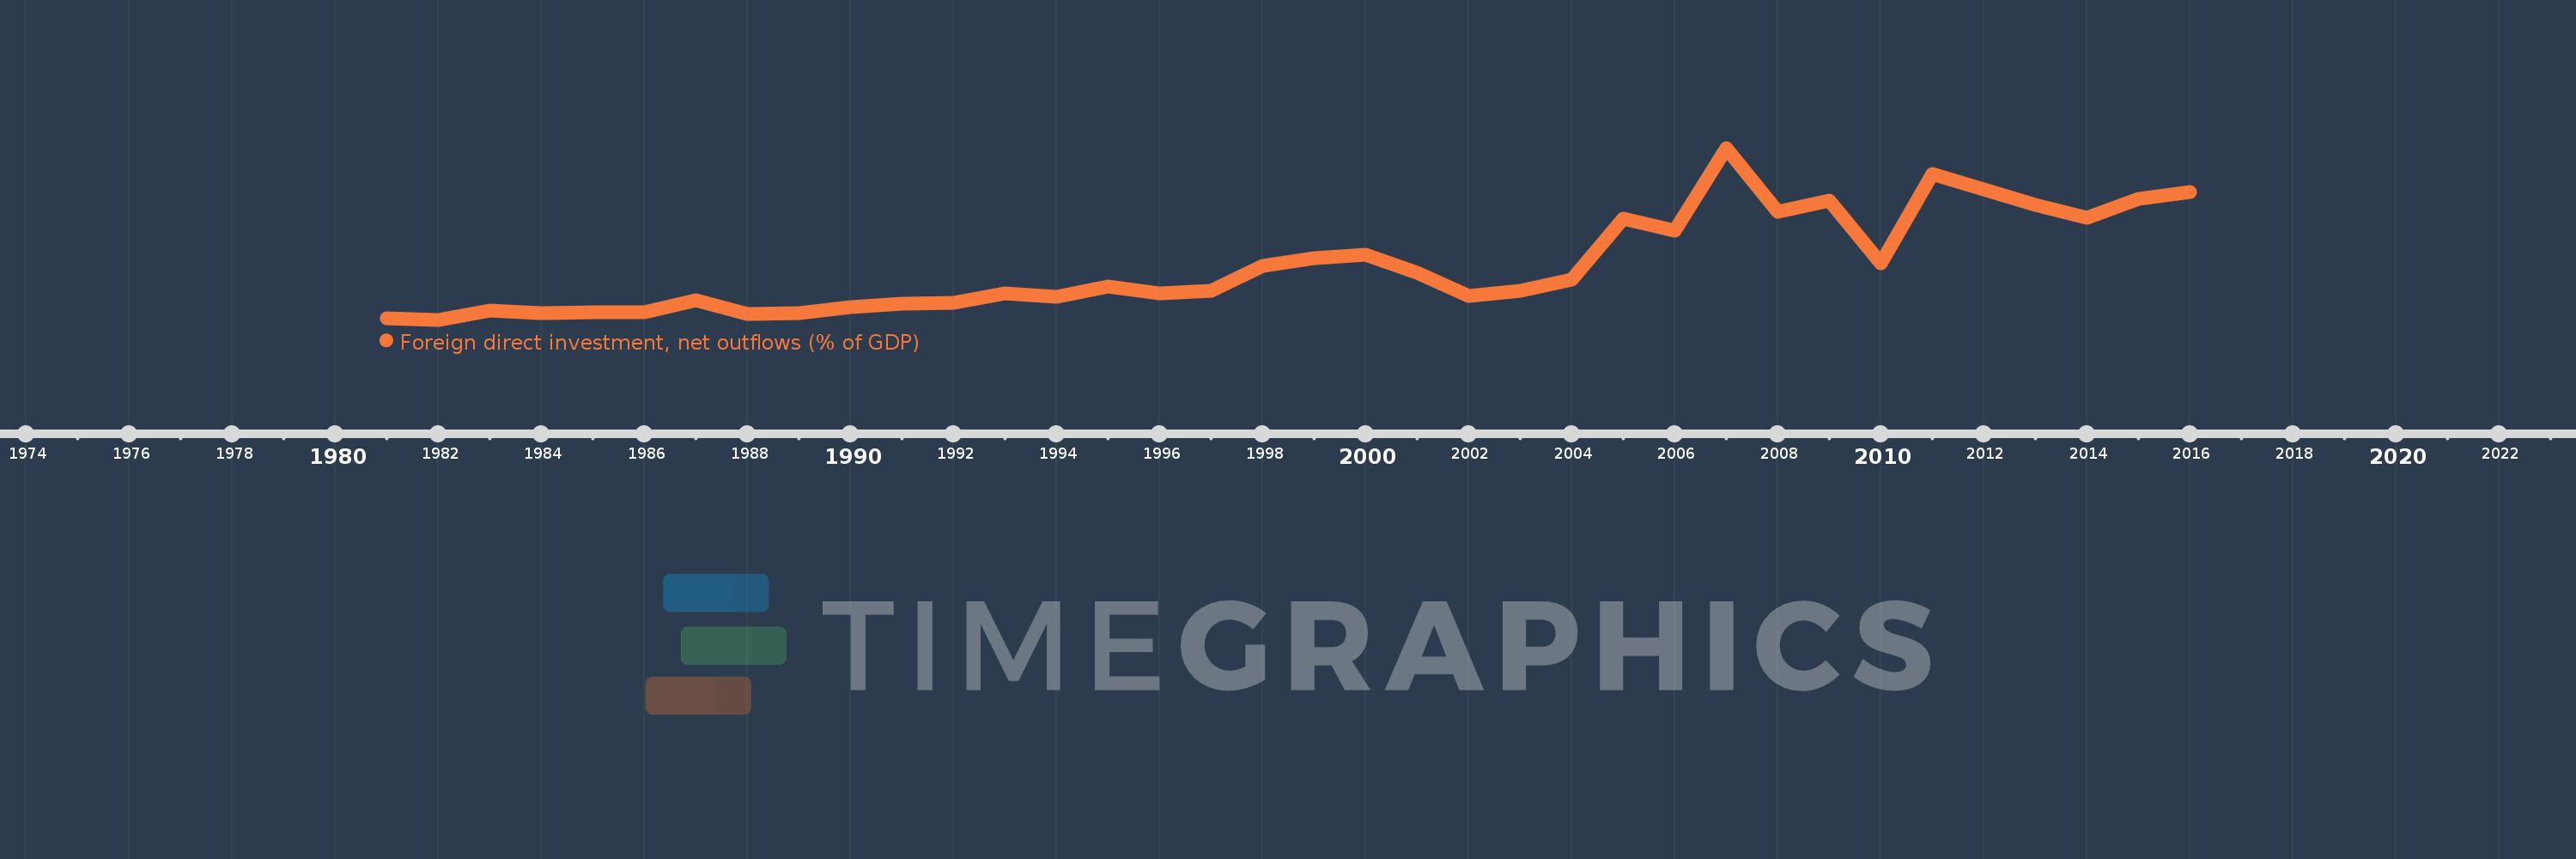
Foreign direct investment, net outflows (% of GDP)
2016,2015,2014,2013,2012,2011,2010,2009,2008,2007,2006,2005,2004,2003,2002,2001,2000,1999,1998,1997,1996,1995,1994,1993,1992,1991,1990,1989,1988,1987,1986,1985,1984,1983,1982,1981
This statistics in other country:
AfghanistanAlbaniaAlgeriaAngolaAntigua and BarbudaArab WorldArgentinaArmeniaArubaAustraliaAustriaAzerbaijanBahamas, TheBahrainBangladeshBarbadosBelarusBelgiumBelizeBeninBermudaBoliviaBosnia and HerzegovinaBotswanaBrazilBrunei DarussalamBulgariaBurkina FasoBurundiCabo VerdeCambodiaCameroonCanadaCaribbean small statesCayman IslandsCentral African RepublicCentral Europe and the BalticsChadChileChinaColombiaComorosCongo, Dem. Rep.Congo, Rep.Costa RicaCote d'IvoireCroatiaCyprusCzech RepublicDenmarkDominicaDominican RepublicEarly-demographic dividendEast Asia & PacificEast Asia & Pacific (excluding high income)East Asia & Pacific (IDA & IBRD countries)EcuadorEgypt, Arab Rep.El SalvadorEquatorial GuineaEritreaEstoniaEuro areaEurope & Central AsiaEurope & Central Asia (excluding high income)Europe & Central Asia (IDA & IBRD countries)European UnionFijiFinlandFragile and conflict affected situationsFranceFrench PolynesiaGabonGambia, TheGeorgiaGermanyGhanaGreeceGrenadaGuatemalaGuineaGuinea-BissauGuyanaHaitiHeavily indebted poor countries (HIPC)High incomeHondurasHong Kong SAR, ChinaHungaryIBRD onlyIcelandIDA & IBRD totalIDA blendIDA onlyIDA totalIndiaIndonesiaIran, Islamic Rep.IraqIrelandIsraelItalyJamaicaJapanJordanKazakhstanKenyaKiribatiKorea, Rep.KosovoKuwaitKyrgyz RepublicLao PDRLate-demographic dividendLatin America & Caribbean Latin America & Caribbean (excluding high income)Latin America & the Caribbean (IDA & IBRD countries)LatviaLeast developed countries: UN classificationLebanonLesothoLiberiaLibyaLithuaniaLow & middle incomeLow incomeLower middle incomeLuxembourgMacao SAR, ChinaMacedonia, FYRMadagascarMalawiMalaysiaMaliMaltaMarshall IslandsMauritaniaMauritiusMexicoMicronesia, Fed. Sts.Middle East & North AfricaMiddle East & North Africa (excluding high income)Middle East & North Africa (IDA & IBRD countries)Middle incomeMoldovaMongoliaMontenegroMoroccoMozambiqueNamibiaNauruNetherlandsNew ZealandNicaraguaNigerNigeriaNorth AmericaNorwayOECD membersOmanOther small statesPacific island small statesPakistanPalauPanamaPapua New GuineaParaguayPeruPhilippinesPolandPortugalPost-demographic dividendPre-demographic dividendQatarRomaniaRussian FederationRwandaSamoaSao Tome and PrincipeSaudi ArabiaSenegalSerbiaSeychellesSierra LeoneSingaporeSlovak RepublicSloveniaSmall statesSolomon IslandsSouth AfricaSouth AsiaSouth Asia (IDA & IBRD)SpainSri LankaSt. Kitts and NevisSt. LuciaSt. Vincent and the GrenadinesSub-Saharan Africa Sub-Saharan Africa (excluding high income)Sub-Saharan Africa (IDA & IBRD countries)SurinameSwazilandSwedenSwitzerlandSyrian Arab RepublicTajikistanTanzaniaThailandTimor-LesteTogoTongaTrinidad and TobagoTunisiaTurkeyUgandaUkraineUnited Arab EmiratesUnited KingdomUnited StatesUpper middle incomeUruguayVanuatuVenezuela, RBVietnamWest Bank and GazaWorldYemen, Rep.ZambiaZimbabwe Timeline:
This timeline shows a graph from 1981 to 2016 of Latin America & the Caribbean (IDA & IBRD countries). No data until 1980. Number of actual observations by date: 36.
Source name:
World Development Indicators
Source organization:
International Monetary Fund, International Financial Statistics and Balance of Payments databases, World Bank, International Debt Statistics, and World Bank and OECD GDP estimates.
Categories, topics:
Economy & Growth, Financial Sector
Last updated:
apr 23, 2017
Indicators value changes by year
Minimum:
-0.001
jan 1, 1982
At the date of observation
Value
Absolute change
Change from previous value
jan 1, 1981
0.013
+0.013
0.0%
jan 1, 1982
-0.001
-0.014
-108.32%
jan 1, 1983
0.076
+0.077
-7.1K%
jan 1, 1984
0.051
-0.024
-32.33%
jan 1, 1985
0.06
+0.009
17.61%
jan 1, 1986
0.057
-0.003
-4.79%
jan 1, 1987
0.158
+0.1
175.25%
jan 1, 1988
0.048
-0.11
-69.62%
jan 1, 1989
0.054
+0.006
13.36%
jan 1, 1990
0.101
+0.047
86.21%
jan 1, 1991
0.131
+0.03
30.01%
jan 1, 1992
0.137
+0.006
4.22%
jan 1, 1993
0.212
+0.075
55.05%
jan 1, 1994
0.186
-0.027
-12.61%
jan 1, 1995
0.273
+0.088
47.18%
jan 1, 1996
0.215
-0.058
-21.4%
jan 1, 1997
0.237
+0.022
10.11%
jan 1, 1998
0.435
+0.199
84.05%
jan 1, 1999
0.497
+0.062
14.27%
jan 1, 2000
0.526
+0.028
5.72%
jan 1, 2001
0.378
-0.148
-28.17%
jan 1, 2002
0.194
-0.184
-48.6%
jan 1, 2003
0.238
+0.044
22.56%
jan 1, 2004
0.324
+0.086
35.96%
jan 1, 2005
0.825
+0.501
154.95%
jan 1, 2006
0.722
-0.103
-12.44%
jan 1, 2007
1.397
+0.675
93.38%
jan 1, 2008
0.875
-0.522
-37.36%
jan 1, 2009
0.969
+0.094
10.73%
jan 1, 2010
0.456
-0.513
-52.98%
jan 1, 2011
1.183
+0.727
159.64%
jan 1, 2012
1.056
-0.127
-10.76%
jan 1, 2013
0.934
-0.121
-11.48%
jan 1, 2014
0.832
-0.103
-10.97%
jan 1, 2015
0.982
+0.151
18.12%
jan 1, 2016
1.039
+0.056
5.74%
Ranking of countries by current statistics by years


Comments: