29
/
en
AIzaSyAYiBZKx7MnpbEhh9jyipgxe19OcubqV5w
April 1, 2024
41439
Latin America & Caribbean
LCN
false
2
1
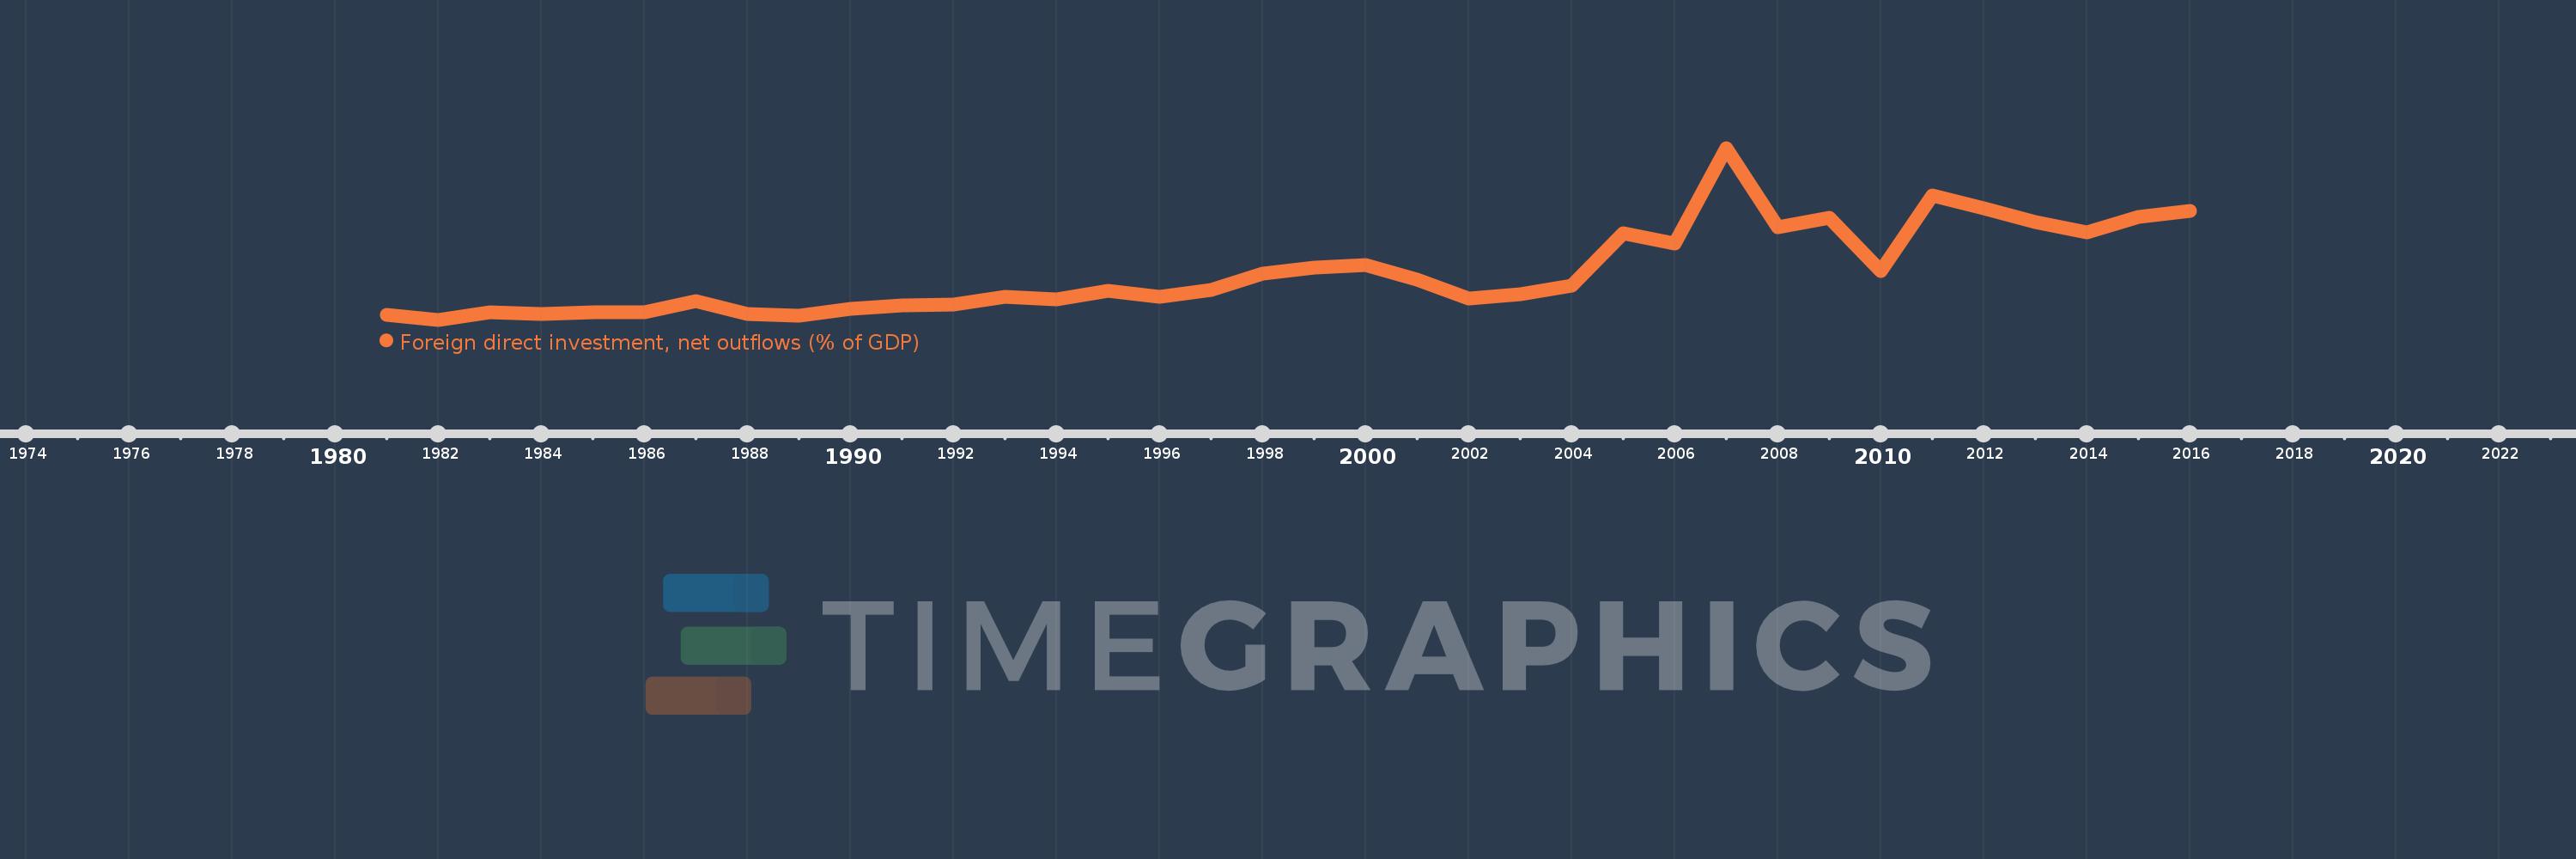
Foreign direct investment, net outflows (% of GDP)
2016,2015,2014,2013,2012,2011,2010,2009,2008,2007,2006,2005,2004,2003,2002,2001,2000,1999,1998,1997,1996,1995,1994,1993,1992,1991,1990,1989,1988,1987,1986,1985,1984,1983,1982,1981
This statistics in other country:
AfghanistanAlbaniaAlgeriaAngolaAntigua and BarbudaArab WorldArgentinaArmeniaArubaAustraliaAustriaAzerbaijanBahamas, TheBahrainBangladeshBarbadosBelarusBelgiumBelizeBeninBermudaBoliviaBosnia and HerzegovinaBotswanaBrazilBrunei DarussalamBulgariaBurkina FasoBurundiCabo VerdeCambodiaCameroonCanadaCaribbean small statesCayman IslandsCentral African RepublicCentral Europe and the BalticsChadChileChinaColombiaComorosCongo, Dem. Rep.Congo, Rep.Costa RicaCote d'IvoireCroatiaCyprusCzech RepublicDenmarkDominicaDominican RepublicEarly-demographic dividendEast Asia & PacificEast Asia & Pacific (excluding high income)East Asia & Pacific (IDA & IBRD countries)EcuadorEgypt, Arab Rep.El SalvadorEquatorial GuineaEritreaEstoniaEuro areaEurope & Central AsiaEurope & Central Asia (excluding high income)Europe & Central Asia (IDA & IBRD countries)European UnionFijiFinlandFragile and conflict affected situationsFranceFrench PolynesiaGabonGambia, TheGeorgiaGermanyGhanaGreeceGrenadaGuatemalaGuineaGuinea-BissauGuyanaHaitiHeavily indebted poor countries (HIPC)High incomeHondurasHong Kong SAR, ChinaHungaryIBRD onlyIcelandIDA & IBRD totalIDA blendIDA onlyIDA totalIndiaIndonesiaIran, Islamic Rep.IraqIrelandIsraelItalyJamaicaJapanJordanKazakhstanKenyaKiribatiKorea, Rep.KosovoKuwaitKyrgyz RepublicLao PDRLate-demographic dividendLatin America & Caribbean Latin America & Caribbean (excluding high income)Latin America & the Caribbean (IDA & IBRD countries)LatviaLeast developed countries: UN classificationLebanonLesothoLiberiaLibyaLithuaniaLow & middle incomeLow incomeLower middle incomeLuxembourgMacao SAR, ChinaMacedonia, FYRMadagascarMalawiMalaysiaMaliMaltaMarshall IslandsMauritaniaMauritiusMexicoMicronesia, Fed. Sts.Middle East & North AfricaMiddle East & North Africa (excluding high income)Middle East & North Africa (IDA & IBRD countries)Middle incomeMoldovaMongoliaMontenegroMoroccoMozambiqueNamibiaNauruNetherlandsNew ZealandNicaraguaNigerNigeriaNorth AmericaNorwayOECD membersOmanOther small statesPacific island small statesPakistanPalauPanamaPapua New GuineaParaguayPeruPhilippinesPolandPortugalPost-demographic dividendPre-demographic dividendQatarRomaniaRussian FederationRwandaSamoaSao Tome and PrincipeSaudi ArabiaSenegalSerbiaSeychellesSierra LeoneSingaporeSlovak RepublicSloveniaSmall statesSolomon IslandsSouth AfricaSouth AsiaSouth Asia (IDA & IBRD)SpainSri LankaSt. Kitts and NevisSt. LuciaSt. Vincent and the GrenadinesSub-Saharan Africa Sub-Saharan Africa (excluding high income)Sub-Saharan Africa (IDA & IBRD countries)SurinameSwazilandSwedenSwitzerlandSyrian Arab RepublicTajikistanTanzaniaThailandTimor-LesteTogoTongaTrinidad and TobagoTunisiaTurkeyUgandaUkraineUnited Arab EmiratesUnited KingdomUnited StatesUpper middle incomeUruguayVanuatuVenezuela, RBVietnamWest Bank and GazaWorldYemen, Rep.ZambiaZimbabwe Timeline:
This timeline shows a graph from 1981 to 2016 of Latin America & Caribbean . No data until 1980. Number of actual observations by date: 36.
Source name:
World Development Indicators
Source organization:
International Monetary Fund, International Financial Statistics and Balance of Payments databases, World Bank, International Debt Statistics, and World Bank and OECD GDP estimates.
Categories, topics:
Economy & Growth, Financial Sector
Last updated:
apr 23, 2017
Indicators value changes by year
Minimum:
-0.008
jan 1, 1982
At the date of observation
Value
Absolute change
Change from previous value
jan 1, 1981
0.04
+0.04
0.0%
jan 1, 1982
-0.008
-0.048
-119.25%
jan 1, 1983
0.064
+0.072
-926.15%
jan 1, 1984
0.045
-0.019
-29.38%
jan 1, 1985
0.061
+0.016
34.96%
jan 1, 1986
0.062
+0.001
1.41%
jan 1, 1987
0.176
+0.114
183.96%
jan 1, 1988
0.051
-0.125
-71.01%
jan 1, 1989
0.035
-0.016
-31.74%
jan 1, 1990
0.101
+0.066
190.35%
jan 1, 1991
0.131
+0.03
29.79%
jan 1, 1992
0.136
+0.005
4.14%
jan 1, 1993
0.212
+0.075
55.17%
jan 1, 1994
0.185
-0.026
-12.5%
jan 1, 1995
0.272
+0.087
47.04%
jan 1, 1996
0.214
-0.058
-21.33%
jan 1, 1997
0.279
+0.065
30.18%
jan 1, 1998
0.434
+0.155
55.45%
jan 1, 1999
0.497
+0.063
14.56%
jan 1, 2000
0.523
+0.026
5.29%
jan 1, 2001
0.383
-0.14
-26.85%
jan 1, 2002
0.198
-0.185
-48.38%
jan 1, 2003
0.238
+0.041
20.65%
jan 1, 2004
0.325
+0.087
36.43%
jan 1, 2005
0.828
+0.503
154.6%
jan 1, 2006
0.724
-0.104
-12.55%
jan 1, 2007
1.65
+0.926
127.88%
jan 1, 2008
0.887
-0.763
-46.24%
jan 1, 2009
0.975
+0.088
9.9%
jan 1, 2010
0.462
-0.513
-52.62%
jan 1, 2011
1.189
+0.727
157.5%
jan 1, 2012
1.067
-0.122
-10.26%
jan 1, 2013
0.932
-0.135
-12.62%
jan 1, 2014
0.835
-0.097
-10.39%
jan 1, 2015
0.987
+0.151
18.12%
jan 1, 2016
1.041
+0.054
5.5%
Ranking of countries by current statistics by years


Comments: