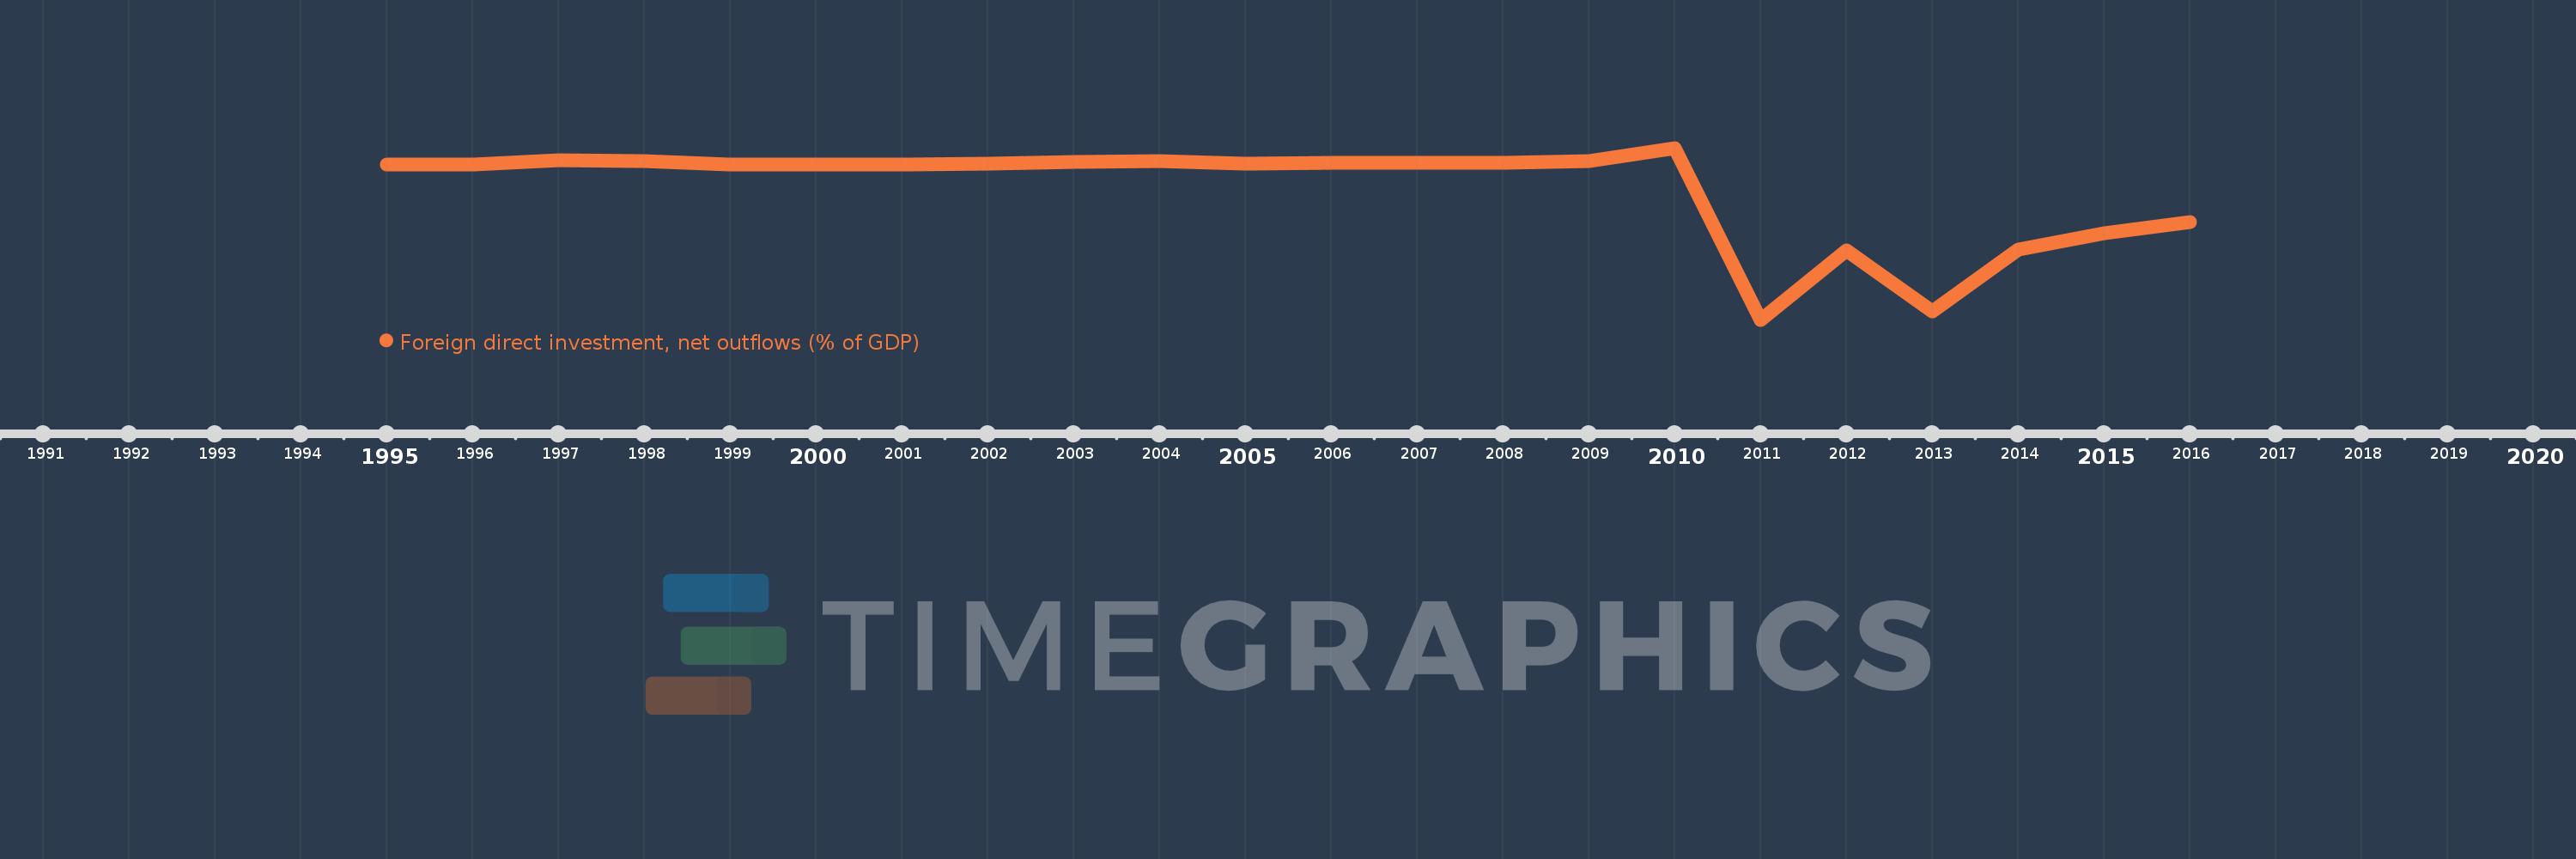
This timeline shows a graph from 1995 to 2016 of Congo, Dem. Rep.. No data until 1994. Number of actual observations by date: 22.
Source name:
World Development Indicators
Source organization:
International Monetary Fund, International Financial Statistics and Balance of Payments databases, World Bank, International Debt Statistics, and World Bank and OECD GDP estimates.
Categories, topics:
Economy & Growth, Financial Sector
Last updated:
apr 23, 2017
Indicators value changes by year
Meaning:
-2.099
Minimum:
-12.722
jan 1, 2011
Maximum:
1.332
jan 1, 2010
At the date of observation
Value
Absolute change
Change from the previous value
jan 1, 1995
0.0
+0.0
0.0%
jan 1, 1996
0.004
+0.004
2.07 mln%
jan 1, 1997
0.335
+0.332
9.35K%
jan 1, 1998
0.282
-0.053
-15.81%
jan 1, 1999
-0.02
-0.302
-106.97%
jan 1, 2000
-0.023
-0.003
14.96%
jan 1, 2001
-0.009
+0.013
-58.3%
jan 1, 2002
0.012
+0.022
-228.31%
jan 1, 2003
0.189
+0.177
1.47K%
jan 1, 2004
0.262
+0.073
38.39%
jan 1, 2005
0.073
-0.189
-71.98%
jan 1, 2006
0.112
+0.039
52.96%
jan 1, 2007
0.128
+0.016
14.26%
jan 1, 2008
0.087
-0.041
-31.93%
jan 1, 2009
0.281
+0.194
222.03%
jan 1, 2010
1.332
+1.05
373.13%
jan 1, 2011
-12.722
-14.054
-1.06K%
jan 1, 2012
-7.073
+5.649
-44.4%
jan 1, 2013
-12.06
-4.987
70.51%
jan 1, 2014
-6.991
+5.07
-42.04%
jan 1, 2015
-5.622
+1.368
-19.57%
jan 1, 2016
-4.749
+0.873
-15.53%
Ranking of countries by current statistics by years
