29
/
en
AIzaSyAYiBZKx7MnpbEhh9jyipgxe19OcubqV5w
April 1, 2024
56617
Small states
SST
false
2
1
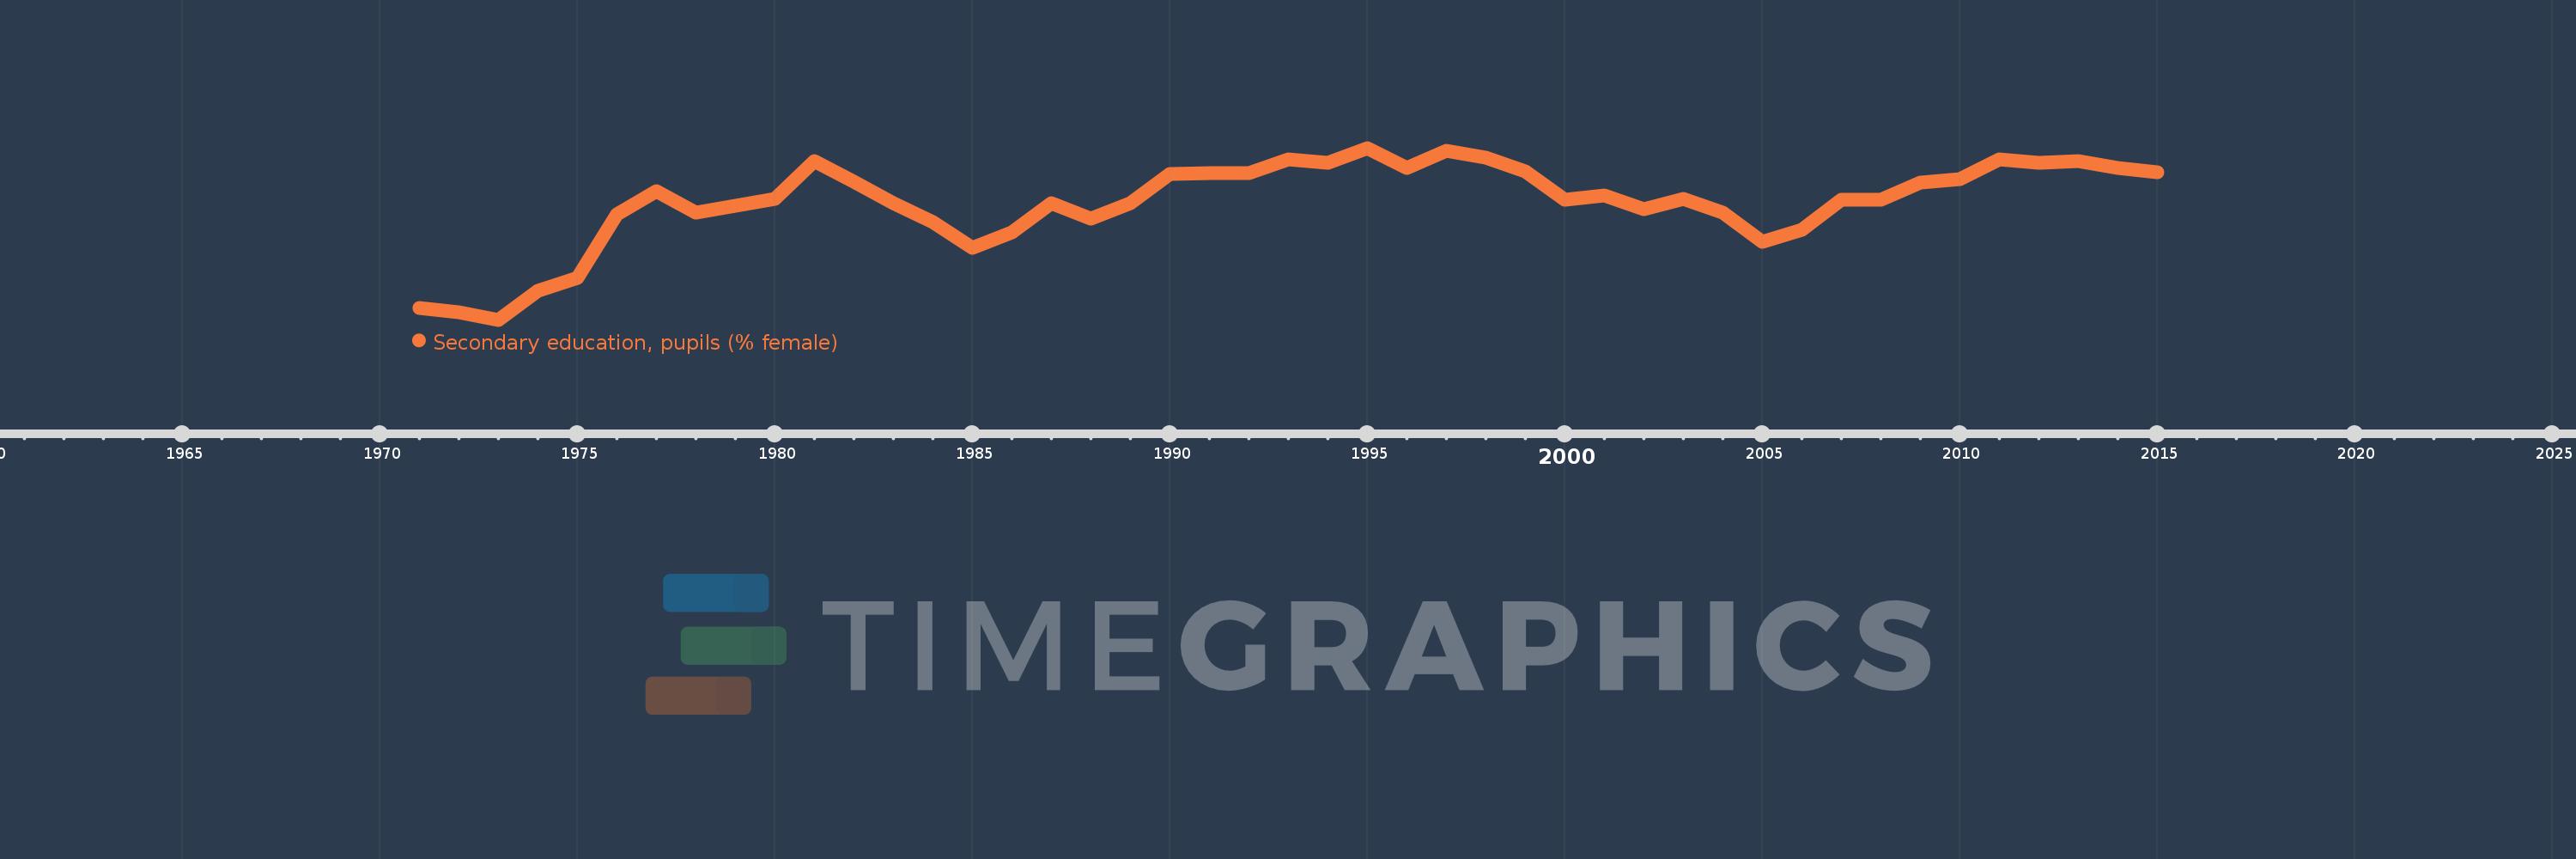
Secondary education, pupils (% female)
2015,2014,2013,2012,2011,2010,2009,2008,2007,2006,2005,2004,2003,2002,2001,2000,1999,1998,1997,1996,1995,1994,1993,1992,1991,1990,1989,1988,1987,1986,1985,1984,1983,1982,1981,1980,1979,1978,1977,1976,1975,1974,1973,1972,1971
This statistics in other country:
AfghanistanAlbaniaAlgeriaAndorraAngolaAntigua and BarbudaArab WorldArgentinaArmeniaArubaAustraliaAustriaAzerbaijanBahamas, TheBahrainBangladeshBarbadosBelarusBelgiumBelizeBeninBermudaBhutanBoliviaBosnia and HerzegovinaBotswanaBrazilBritish Virgin IslandsBrunei DarussalamBulgariaBurkina FasoBurundiCabo VerdeCambodiaCameroonCanadaCaribbean small statesCayman IslandsCentral African RepublicCentral Europe and the BalticsChadChileChinaColombiaComorosCongo, Dem. Rep.Congo, Rep.Costa RicaCote d'IvoireCroatiaCubaCuracaoCyprusCzech RepublicDenmarkDjiboutiDominicaDominican RepublicEarly-demographic dividendEast Asia & PacificEast Asia & Pacific (excluding high income)East Asia & Pacific (IDA & IBRD countries)EcuadorEgypt, Arab Rep.El SalvadorEquatorial GuineaEritreaEstoniaEthiopiaEuro areaEurope & Central AsiaEurope & Central Asia (excluding high income)Europe & Central Asia (IDA & IBRD countries)European UnionFijiFinlandFragile and conflict affected situationsFranceGabonGambia, TheGeorgiaGermanyGhanaGibraltarGreeceGrenadaGuatemalaGuineaGuinea-BissauGuyanaHeavily indebted poor countries (HIPC)High incomeHondurasHong Kong SAR, ChinaHungaryIBRD onlyIcelandIDA & IBRD totalIDA blendIDA onlyIDA totalIndiaIndonesiaIran, Islamic Rep.IraqIrelandIsraelItalyJamaicaJapanJordanKazakhstanKenyaKiribatiKorea, Dem. People’s Rep.Korea, Rep.KuwaitKyrgyz RepublicLao PDRLate-demographic dividendLatin America & Caribbean Latin America & Caribbean (excluding high income)Latin America & the Caribbean (IDA & IBRD countries)LatviaLeast developed countries: UN classificationLebanonLesothoLiberiaLibyaLiechtensteinLithuaniaLow & middle incomeLow incomeLower middle incomeLuxembourgMacao SAR, ChinaMacedonia, FYRMadagascarMalawiMalaysiaMaldivesMaliMaltaMarshall IslandsMauritaniaMauritiusMexicoMicronesia, Fed. Sts.Middle East & North AfricaMiddle East & North Africa (excluding high income)Middle East & North Africa (IDA & IBRD countries)Middle incomeMoldovaMonacoMongoliaMontenegroMoroccoMozambiqueMyanmarNamibiaNauruNepalNetherlandsNew ZealandNicaraguaNigerNigeriaNorth AmericaNorwayOECD membersOmanOther small statesPacific island small statesPakistanPalauPanamaPapua New GuineaParaguayPeruPhilippinesPolandPortugalPost-demographic dividendPre-demographic dividendPuerto RicoQatarRomaniaRussian FederationRwandaSamoaSan MarinoSao Tome and PrincipeSaudi ArabiaSenegalSerbiaSeychellesSierra LeoneSingaporeSint Maarten (Dutch part)Slovak RepublicSloveniaSmall statesSolomon IslandsSomaliaSouth AfricaSouth AsiaSouth Asia (IDA & IBRD)SpainSri LankaSt. Kitts and NevisSt. LuciaSt. Vincent and the GrenadinesSub-Saharan Africa Sub-Saharan Africa (excluding high income)Sub-Saharan Africa (IDA & IBRD countries)SudanSurinameSwazilandSwedenSwitzerlandSyrian Arab RepublicTajikistanTanzaniaThailandTimor-LesteTogoTongaTrinidad and TobagoTunisiaTurkeyTurkmenistanTurks and Caicos IslandsTuvaluUgandaUkraineUnited Arab EmiratesUnited KingdomUnited StatesUpper middle incomeUruguayUzbekistanVanuatuVenezuela, RBVietnamWest Bank and GazaWorldYemen, Rep.ZambiaZimbabwe Timeline:
This timeline shows a graph from 1971 to 2015 of Small states. No data until 1970. Number of actual observations by date: 45.
Source name:
World Development Indicators
Source organization:
United Nations Educational, Scientific, and Cultural Organization (UNESCO) Institute for Statistics.
Categories, topics:
Education, Gender
Last updated:
apr 23, 2017
Indicators value changes by year
Minimum:
48.652
jan 1, 1973
Maximum:
50.046
jan 1, 1995
At the date of observation
Value
Absolute change
Change from previous value
jan 1, 1971
48.75
+48.75
0.0%
jan 1, 1972
48.712
-0.039
-0.08%
jan 1, 1973
48.652
-0.06
-0.12%
jan 1, 1974
48.885
+0.233
0.48%
jan 1, 1975
48.993
+0.108
0.22%
jan 1, 1976
49.508
+0.515
1.05%
jan 1, 1977
49.693
+0.185
0.37%
jan 1, 1978
49.522
-0.17
-0.34%
jan 1, 1979
49.58
+0.058
0.12%
jan 1, 1980
49.636
+0.056
0.11%
jan 1, 1981
49.939
+0.303
0.61%
jan 1, 1982
49.77
-0.169
-0.34%
jan 1, 1983
49.601
-0.169
-0.34%
jan 1, 1984
49.442
-0.159
-0.32%
jan 1, 1985
49.236
-0.206
-0.42%
jan 1, 1986
49.36
+0.124
0.25%
jan 1, 1987
49.596
+0.236
0.48%
jan 1, 1988
49.471
-0.124
-0.25%
jan 1, 1989
49.598
+0.126
0.26%
jan 1, 1990
49.833
+0.235
0.47%
jan 1, 1991
49.841
+0.008
0.02%
jan 1, 1992
49.843
+0.001
0.0%
jan 1, 1993
49.95
+0.107
0.21%
jan 1, 1994
49.926
-0.024
-0.05%
jan 1, 1995
50.046
+0.12
0.24%
jan 1, 1996
49.883
-0.164
-0.33%
jan 1, 1997
50.024
+0.142
0.28%
jan 1, 1998
49.964
-0.06
-0.12%
jan 1, 1999
49.854
-0.11
-0.22%
jan 1, 2000
49.629
-0.226
-0.45%
jan 1, 2001
49.664
+0.035
0.07%
jan 1, 2002
49.55
-0.114
-0.23%
jan 1, 2003
49.632
+0.082
0.16%
jan 1, 2004
49.518
-0.114
-0.23%
jan 1, 2005
49.287
-0.231
-0.47%
jan 1, 2006
49.383
+0.096
0.2%
jan 1, 2007
49.623
+0.24
0.49%
jan 1, 2008
49.627
+0.004
0.01%
jan 1, 2009
49.763
+0.137
0.28%
jan 1, 2010
49.796
+0.033
0.07%
jan 1, 2011
49.952
+0.157
0.31%
jan 1, 2012
49.923
-0.029
-0.06%
jan 1, 2013
49.94
+0.017
0.03%
jan 1, 2014
49.885
-0.056
-0.11%
jan 1, 2015
49.849
-0.036
-0.07%
Ranking of countries by current statistics by years


Comments: