29
/
en
AIzaSyAYiBZKx7MnpbEhh9jyipgxe19OcubqV5w
April 1, 2024
143556
Grenada
GRD
true
2
1
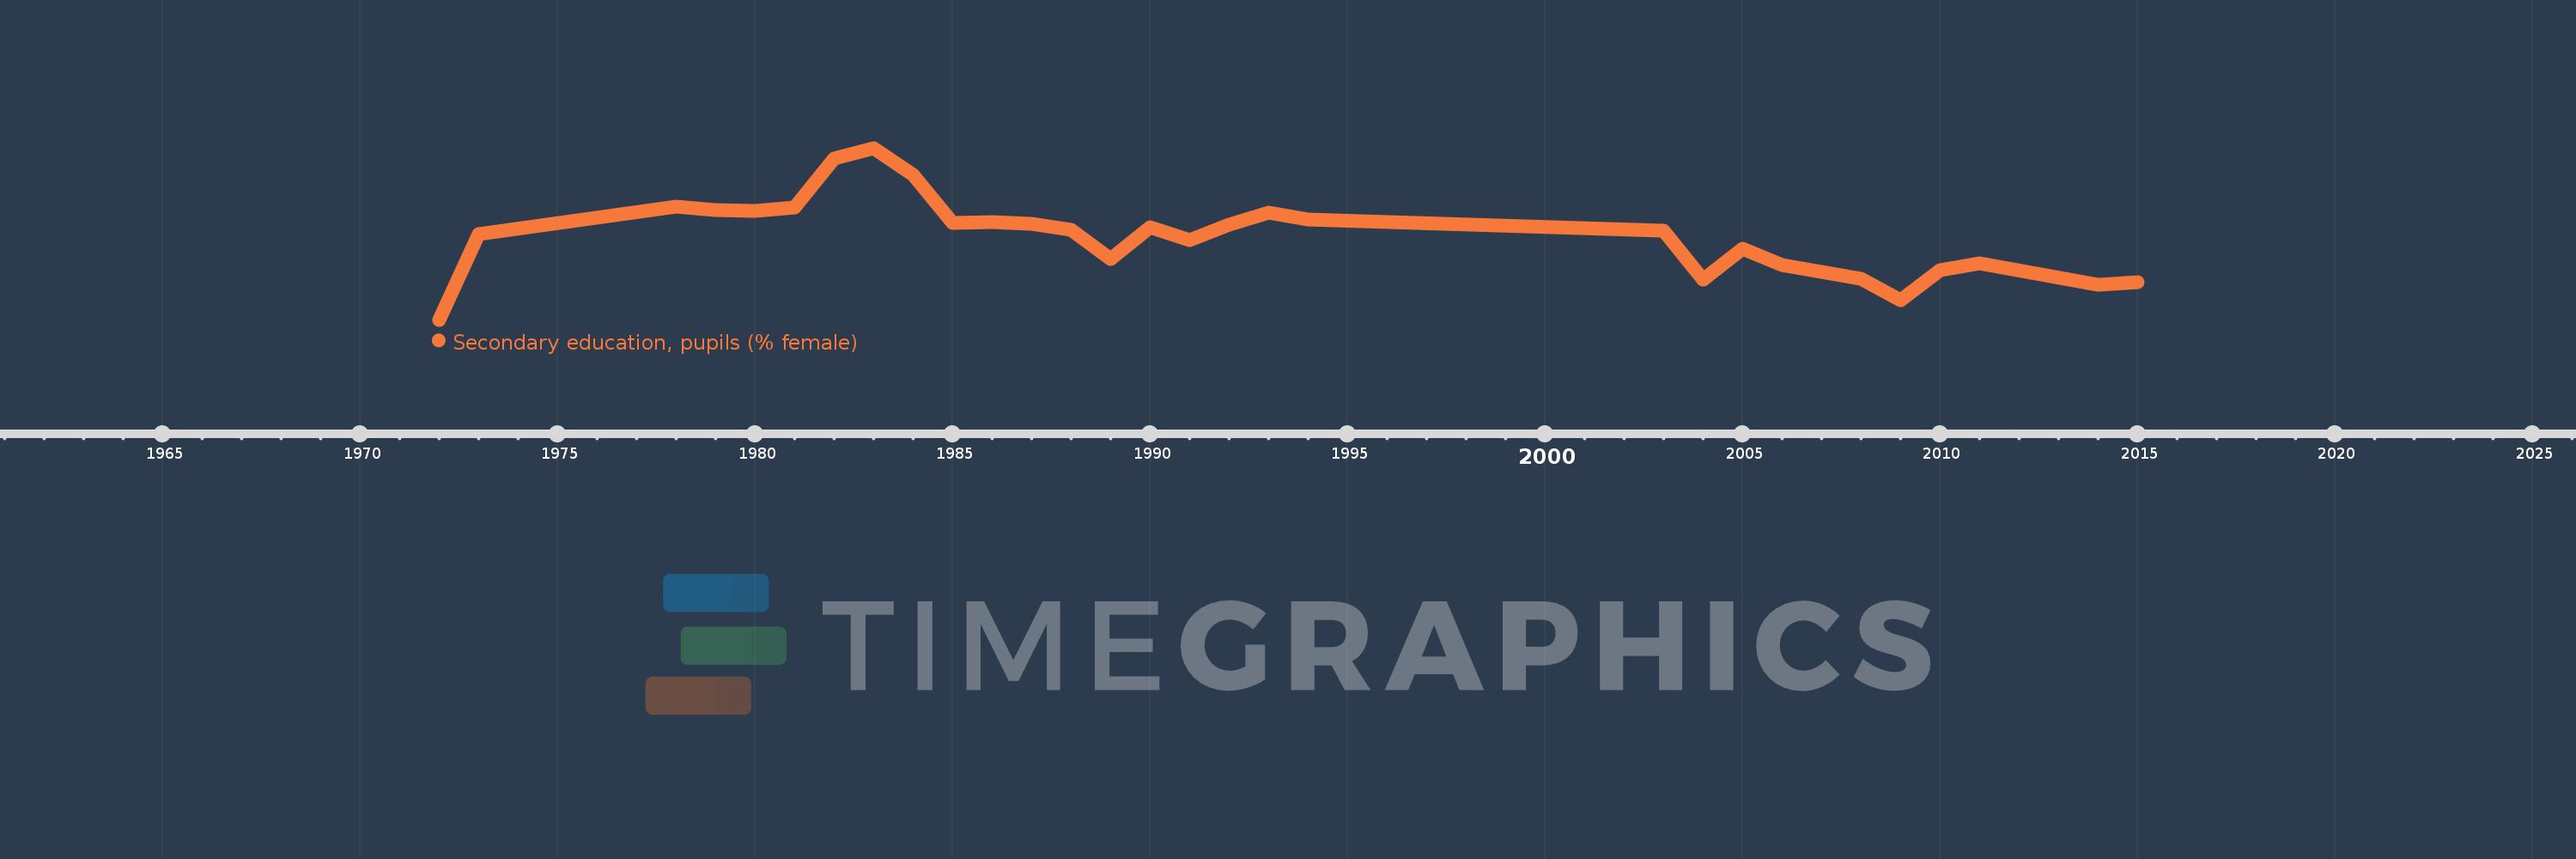
Secondary education, pupils (% female)
2015,2014,2011,2010,2009,2008,2006,2005,2004,2003,1994,1993,1992,1991,1990,1989,1988,1987,1986,1985,1984,1983,1982,1981,1980,1979,1978,1973,1972
This statistics in other country:
AfghanistanAlbaniaAlgeriaAndorraAngolaAntigua and BarbudaArab WorldArgentinaArmeniaArubaAustraliaAustriaAzerbaijanBahamas, TheBahrainBangladeshBarbadosBelarusBelgiumBelizeBeninBermudaBhutanBoliviaBosnia and HerzegovinaBotswanaBrazilBritish Virgin IslandsBrunei DarussalamBulgariaBurkina FasoBurundiCabo VerdeCambodiaCameroonCanadaCaribbean small statesCayman IslandsCentral African RepublicCentral Europe and the BalticsChadChileChinaColombiaComorosCongo, Dem. Rep.Congo, Rep.Costa RicaCote d'IvoireCroatiaCubaCuracaoCyprusCzech RepublicDenmarkDjiboutiDominicaDominican RepublicEarly-demographic dividendEast Asia & PacificEast Asia & Pacific (excluding high income)East Asia & Pacific (IDA & IBRD countries)EcuadorEgypt, Arab Rep.El SalvadorEquatorial GuineaEritreaEstoniaEthiopiaEuro areaEurope & Central AsiaEurope & Central Asia (excluding high income)Europe & Central Asia (IDA & IBRD countries)European UnionFijiFinlandFragile and conflict affected situationsFranceGabonGambia, TheGeorgiaGermanyGhanaGibraltarGreeceGrenadaGuatemalaGuineaGuinea-BissauGuyanaHeavily indebted poor countries (HIPC)High incomeHondurasHong Kong SAR, ChinaHungaryIBRD onlyIcelandIDA & IBRD totalIDA blendIDA onlyIDA totalIndiaIndonesiaIran, Islamic Rep.IraqIrelandIsraelItalyJamaicaJapanJordanKazakhstanKenyaKiribatiKorea, Dem. People’s Rep.Korea, Rep.KuwaitKyrgyz RepublicLao PDRLate-demographic dividendLatin America & Caribbean Latin America & Caribbean (excluding high income)Latin America & the Caribbean (IDA & IBRD countries)LatviaLeast developed countries: UN classificationLebanonLesothoLiberiaLibyaLiechtensteinLithuaniaLow & middle incomeLow incomeLower middle incomeLuxembourgMacao SAR, ChinaMacedonia, FYRMadagascarMalawiMalaysiaMaldivesMaliMaltaMarshall IslandsMauritaniaMauritiusMexicoMicronesia, Fed. Sts.Middle East & North AfricaMiddle East & North Africa (excluding high income)Middle East & North Africa (IDA & IBRD countries)Middle incomeMoldovaMonacoMongoliaMontenegroMoroccoMozambiqueMyanmarNamibiaNauruNepalNetherlandsNew ZealandNicaraguaNigerNigeriaNorth AmericaNorwayOECD membersOmanOther small statesPacific island small statesPakistanPalauPanamaPapua New GuineaParaguayPeruPhilippinesPolandPortugalPost-demographic dividendPre-demographic dividendPuerto RicoQatarRomaniaRussian FederationRwandaSamoaSan MarinoSao Tome and PrincipeSaudi ArabiaSenegalSerbiaSeychellesSierra LeoneSingaporeSint Maarten (Dutch part)Slovak RepublicSloveniaSmall statesSolomon IslandsSomaliaSouth AfricaSouth AsiaSouth Asia (IDA & IBRD)SpainSri LankaSt. Kitts and NevisSt. LuciaSt. Vincent and the GrenadinesSub-Saharan Africa Sub-Saharan Africa (excluding high income)Sub-Saharan Africa (IDA & IBRD countries)SudanSurinameSwazilandSwedenSwitzerlandSyrian Arab RepublicTajikistanTanzaniaThailandTimor-LesteTogoTongaTrinidad and TobagoTunisiaTurkeyTurkmenistanTurks and Caicos IslandsTuvaluUgandaUkraineUnited Arab EmiratesUnited KingdomUnited StatesUpper middle incomeUruguayUzbekistanVanuatuVenezuela, RBVietnamWest Bank and GazaWorldYemen, Rep.ZambiaZimbabwe Timeline:
This timeline shows a graph from 1972 to 2015 of Grenada. No data until 1971. Number of actual observations by date: 29.
Source name:
World Development Indicators
Source organization:
United Nations Educational, Scientific, and Cultural Organization (UNESCO) Institute for Statistics.
Categories, topics:
Education, Gender
Last updated:
apr 23, 2017
Indicators value changes by year
Minimum:
45.773
jan 1, 1972
Maximum:
59.433
jan 1, 1983
At the date of observation
Value
Absolute change
Change from previous value
jan 1, 1972
45.773
+45.773
0.0%
jan 1, 1973
52.607
+6.834
14.93%
jan 1, 1978
54.798
+2.191
4.16%
jan 1, 1979
54.51
-0.288
-0.52%
jan 1, 1980
54.415
-0.096
-0.18%
jan 1, 1981
54.712
+0.297
0.55%
jan 1, 1982
58.613
+3.902
7.13%
jan 1, 1983
59.433
+0.82
1.4%
jan 1, 1984
57.263
-2.17
-3.65%
jan 1, 1985
53.502
-3.761
-6.57%
jan 1, 1986
53.538
+0.036
0.07%
jan 1, 1987
53.39
-0.148
-0.28%
jan 1, 1988
52.891
-0.5
-0.94%
jan 1, 1989
50.573
-2.318
-4.38%
jan 1, 1990
53.139
+2.566
5.07%
jan 1, 1991
52.094
-1.044
-1.97%
jan 1, 1992
53.345
+1.251
2.4%
jan 1, 1993
54.305
+0.96
1.8%
jan 1, 1994
53.745
-0.56
-1.03%
jan 1, 2003
52.872
-0.873
-1.62%
jan 1, 2004
48.943
-3.929
-7.43%
jan 1, 2005
51.442
+2.499
5.11%
jan 1, 2006
50.147
-1.295
-2.52%
jan 1, 2008
49.043
-1.105
-2.2%
jan 1, 2009
47.333
-1.709
-3.49%
jan 1, 2010
49.687
+2.354
4.97%
jan 1, 2011
50.27
+0.582
1.17%
jan 1, 2014
48.569
-1.701
-3.38%
jan 1, 2015
48.778
+0.209
0.43%
Ranking of countries by current statistics by years


Comments: