29
/
en
AIzaSyAYiBZKx7MnpbEhh9jyipgxe19OcubqV5w
April 1, 2024
32182
Europe & Central Asia (excluding high income)
ECA
false
2
1
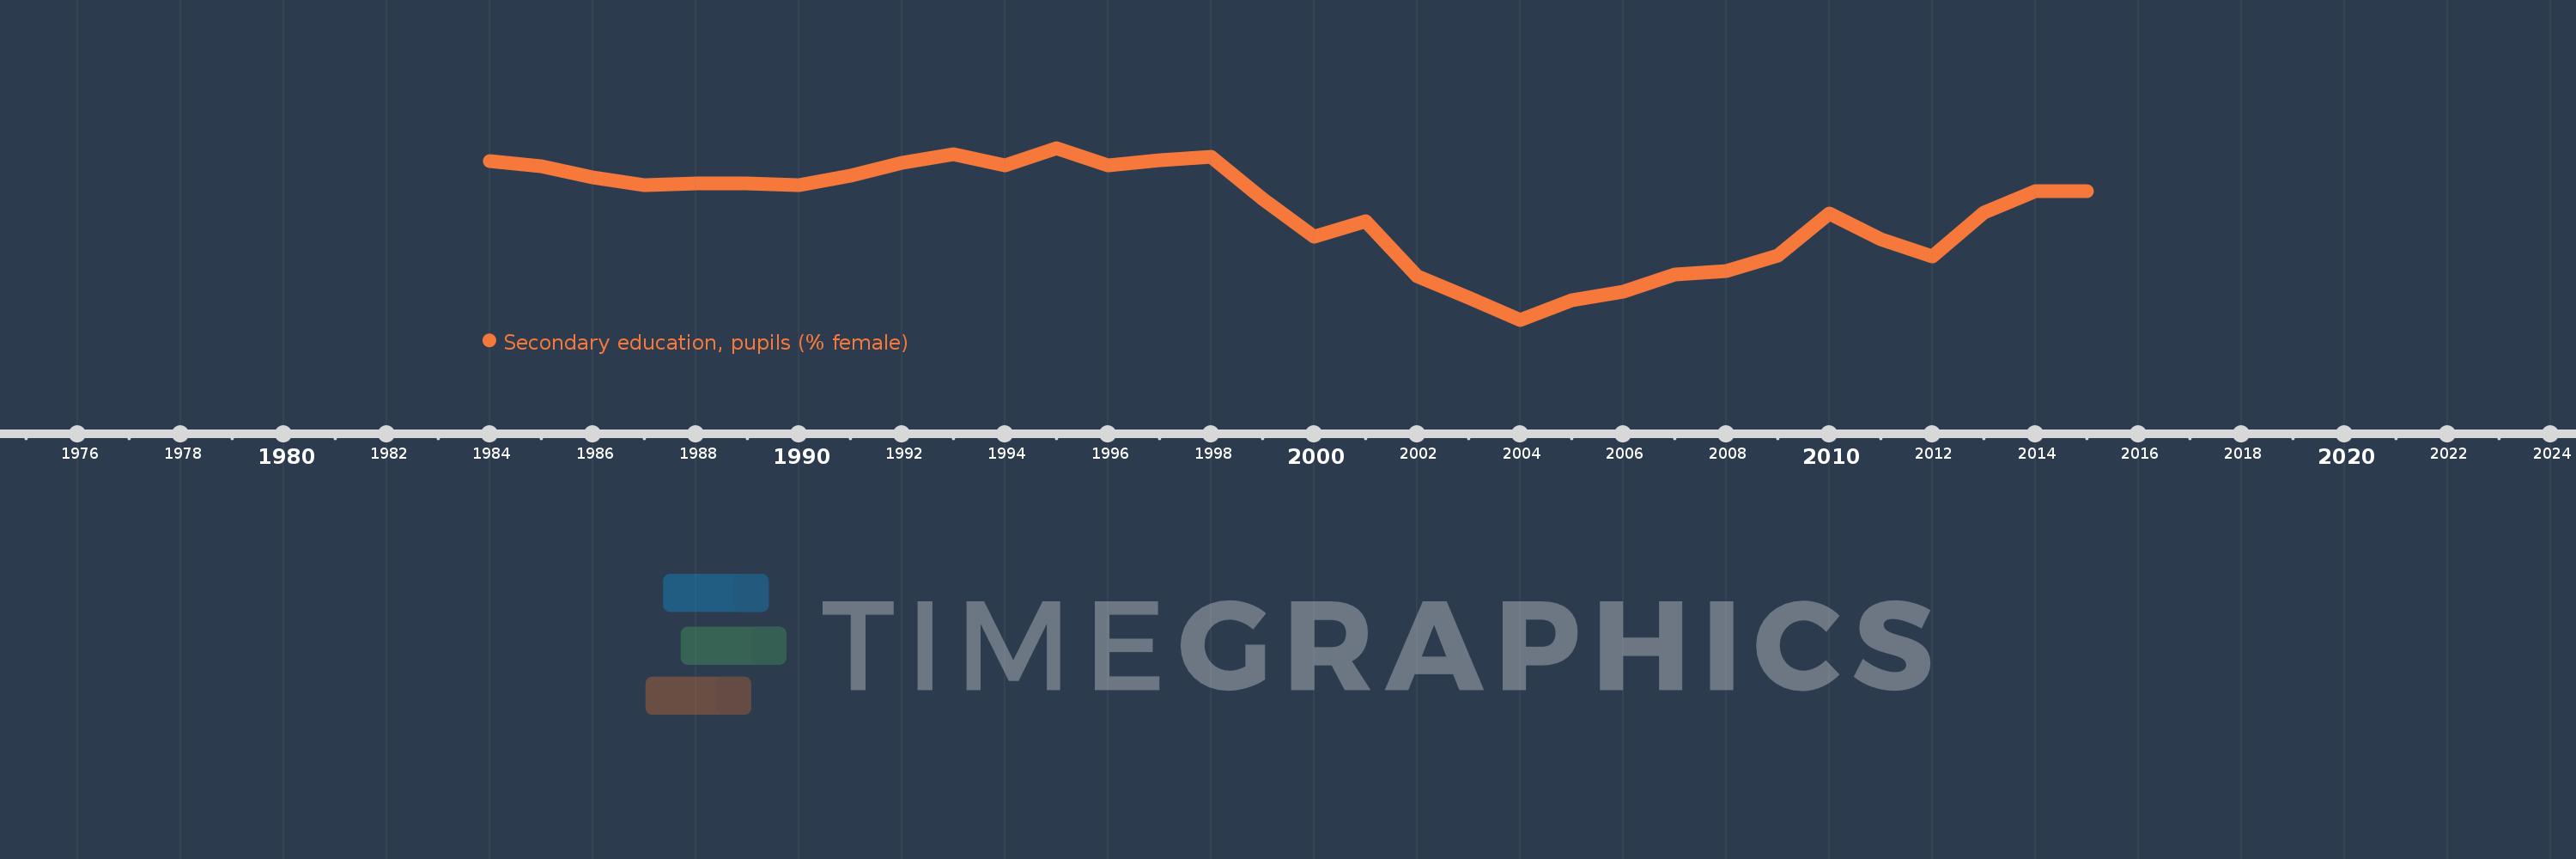
Secondary education, pupils (% female)
2015,2014,2013,2012,2011,2010,2009,2008,2007,2006,2005,2004,2003,2002,2001,2000,1999,1998,1997,1996,1995,1994,1993,1992,1991,1990,1989,1988,1987,1986,1985,1984
This statistics in other country:
AfghanistanAlbaniaAlgeriaAndorraAngolaAntigua and BarbudaArab WorldArgentinaArmeniaArubaAustraliaAustriaAzerbaijanBahamas, TheBahrainBangladeshBarbadosBelarusBelgiumBelizeBeninBermudaBhutanBoliviaBosnia and HerzegovinaBotswanaBrazilBritish Virgin IslandsBrunei DarussalamBulgariaBurkina FasoBurundiCabo VerdeCambodiaCameroonCanadaCaribbean small statesCayman IslandsCentral African RepublicCentral Europe and the BalticsChadChileChinaColombiaComorosCongo, Dem. Rep.Congo, Rep.Costa RicaCote d'IvoireCroatiaCubaCuracaoCyprusCzech RepublicDenmarkDjiboutiDominicaDominican RepublicEarly-demographic dividendEast Asia & PacificEast Asia & Pacific (excluding high income)East Asia & Pacific (IDA & IBRD countries)EcuadorEgypt, Arab Rep.El SalvadorEquatorial GuineaEritreaEstoniaEthiopiaEuro areaEurope & Central AsiaEurope & Central Asia (excluding high income)Europe & Central Asia (IDA & IBRD countries)European UnionFijiFinlandFragile and conflict affected situationsFranceGabonGambia, TheGeorgiaGermanyGhanaGibraltarGreeceGrenadaGuatemalaGuineaGuinea-BissauGuyanaHeavily indebted poor countries (HIPC)High incomeHondurasHong Kong SAR, ChinaHungaryIBRD onlyIcelandIDA & IBRD totalIDA blendIDA onlyIDA totalIndiaIndonesiaIran, Islamic Rep.IraqIrelandIsraelItalyJamaicaJapanJordanKazakhstanKenyaKiribatiKorea, Dem. People’s Rep.Korea, Rep.KuwaitKyrgyz RepublicLao PDRLate-demographic dividendLatin America & Caribbean Latin America & Caribbean (excluding high income)Latin America & the Caribbean (IDA & IBRD countries)LatviaLeast developed countries: UN classificationLebanonLesothoLiberiaLibyaLiechtensteinLithuaniaLow & middle incomeLow incomeLower middle incomeLuxembourgMacao SAR, ChinaMacedonia, FYRMadagascarMalawiMalaysiaMaldivesMaliMaltaMarshall IslandsMauritaniaMauritiusMexicoMicronesia, Fed. Sts.Middle East & North AfricaMiddle East & North Africa (excluding high income)Middle East & North Africa (IDA & IBRD countries)Middle incomeMoldovaMonacoMongoliaMontenegroMoroccoMozambiqueMyanmarNamibiaNauruNepalNetherlandsNew ZealandNicaraguaNigerNigeriaNorth AmericaNorwayOECD membersOmanOther small statesPacific island small statesPakistanPalauPanamaPapua New GuineaParaguayPeruPhilippinesPolandPortugalPost-demographic dividendPre-demographic dividendPuerto RicoQatarRomaniaRussian FederationRwandaSamoaSan MarinoSao Tome and PrincipeSaudi ArabiaSenegalSerbiaSeychellesSierra LeoneSingaporeSint Maarten (Dutch part)Slovak RepublicSloveniaSmall statesSolomon IslandsSomaliaSouth AfricaSouth AsiaSouth Asia (IDA & IBRD)SpainSri LankaSt. Kitts and NevisSt. LuciaSt. Vincent and the GrenadinesSub-Saharan Africa Sub-Saharan Africa (excluding high income)Sub-Saharan Africa (IDA & IBRD countries)SudanSurinameSwazilandSwedenSwitzerlandSyrian Arab RepublicTajikistanTanzaniaThailandTimor-LesteTogoTongaTrinidad and TobagoTunisiaTurkeyTurkmenistanTurks and Caicos IslandsTuvaluUgandaUkraineUnited Arab EmiratesUnited KingdomUnited StatesUpper middle incomeUruguayUzbekistanVanuatuVenezuela, RBVietnamWest Bank and GazaWorldYemen, Rep.ZambiaZimbabwe Timeline:
This timeline shows a graph from 1984 to 2015 of Europe & Central Asia (excluding high income). No data until 1983. Number of actual observations by date: 32.
Source name:
World Development Indicators
Source organization:
United Nations Educational, Scientific, and Cultural Organization (UNESCO) Institute for Statistics.
Categories, topics:
Education, Gender
Last updated:
apr 23, 2017
Indicators value changes by year
Minimum:
47.662
jan 1, 2004
Maximum:
48.491
jan 1, 1995
At the date of observation
Value
Absolute change
Change from previous value
jan 1, 1984
48.428
+48.428
0.0%
jan 1, 1985
48.403
-0.025
-0.05%
jan 1, 1986
48.35
-0.052
-0.11%
jan 1, 1987
48.31
-0.04
-0.08%
jan 1, 1988
48.32
+0.01
0.02%
jan 1, 1989
48.32
+0.0
0.0%
jan 1, 1990
48.312
-0.007
-0.02%
jan 1, 1991
48.358
+0.045
0.09%
jan 1, 1992
48.42
+0.062
0.13%
jan 1, 1993
48.459
+0.039
0.08%
jan 1, 1994
48.408
-0.051
-0.1%
jan 1, 1995
48.491
+0.083
0.17%
jan 1, 1996
48.406
-0.085
-0.18%
jan 1, 1997
48.43
+0.023
0.05%
jan 1, 1998
48.45
+0.02
0.04%
jan 1, 1999
48.245
-0.206
-0.42%
jan 1, 2000
48.062
-0.183
-0.38%
jan 1, 2001
48.139
+0.078
0.16%
jan 1, 2002
47.874
-0.266
-0.55%
jan 1, 2003
47.77
-0.104
-0.22%
jan 1, 2004
47.662
-0.108
-0.23%
jan 1, 2005
47.755
+0.094
0.2%
jan 1, 2006
47.799
+0.044
0.09%
jan 1, 2007
47.882
+0.083
0.17%
jan 1, 2008
47.895
+0.013
0.03%
jan 1, 2009
47.972
+0.077
0.16%
jan 1, 2010
48.175
+0.204
0.42%
jan 1, 2011
48.05
-0.125
-0.26%
jan 1, 2012
47.969
-0.082
-0.17%
jan 1, 2013
48.177
+0.208
0.43%
jan 1, 2014
48.281
+0.105
0.22%
jan 1, 2015
48.282
+0.0
0.0%
Ranking of countries by current statistics by years


Comments: