29
/
en
AIzaSyAYiBZKx7MnpbEhh9jyipgxe19OcubqV5w
April 1, 2024
212368
Niger
NER
true
2
1
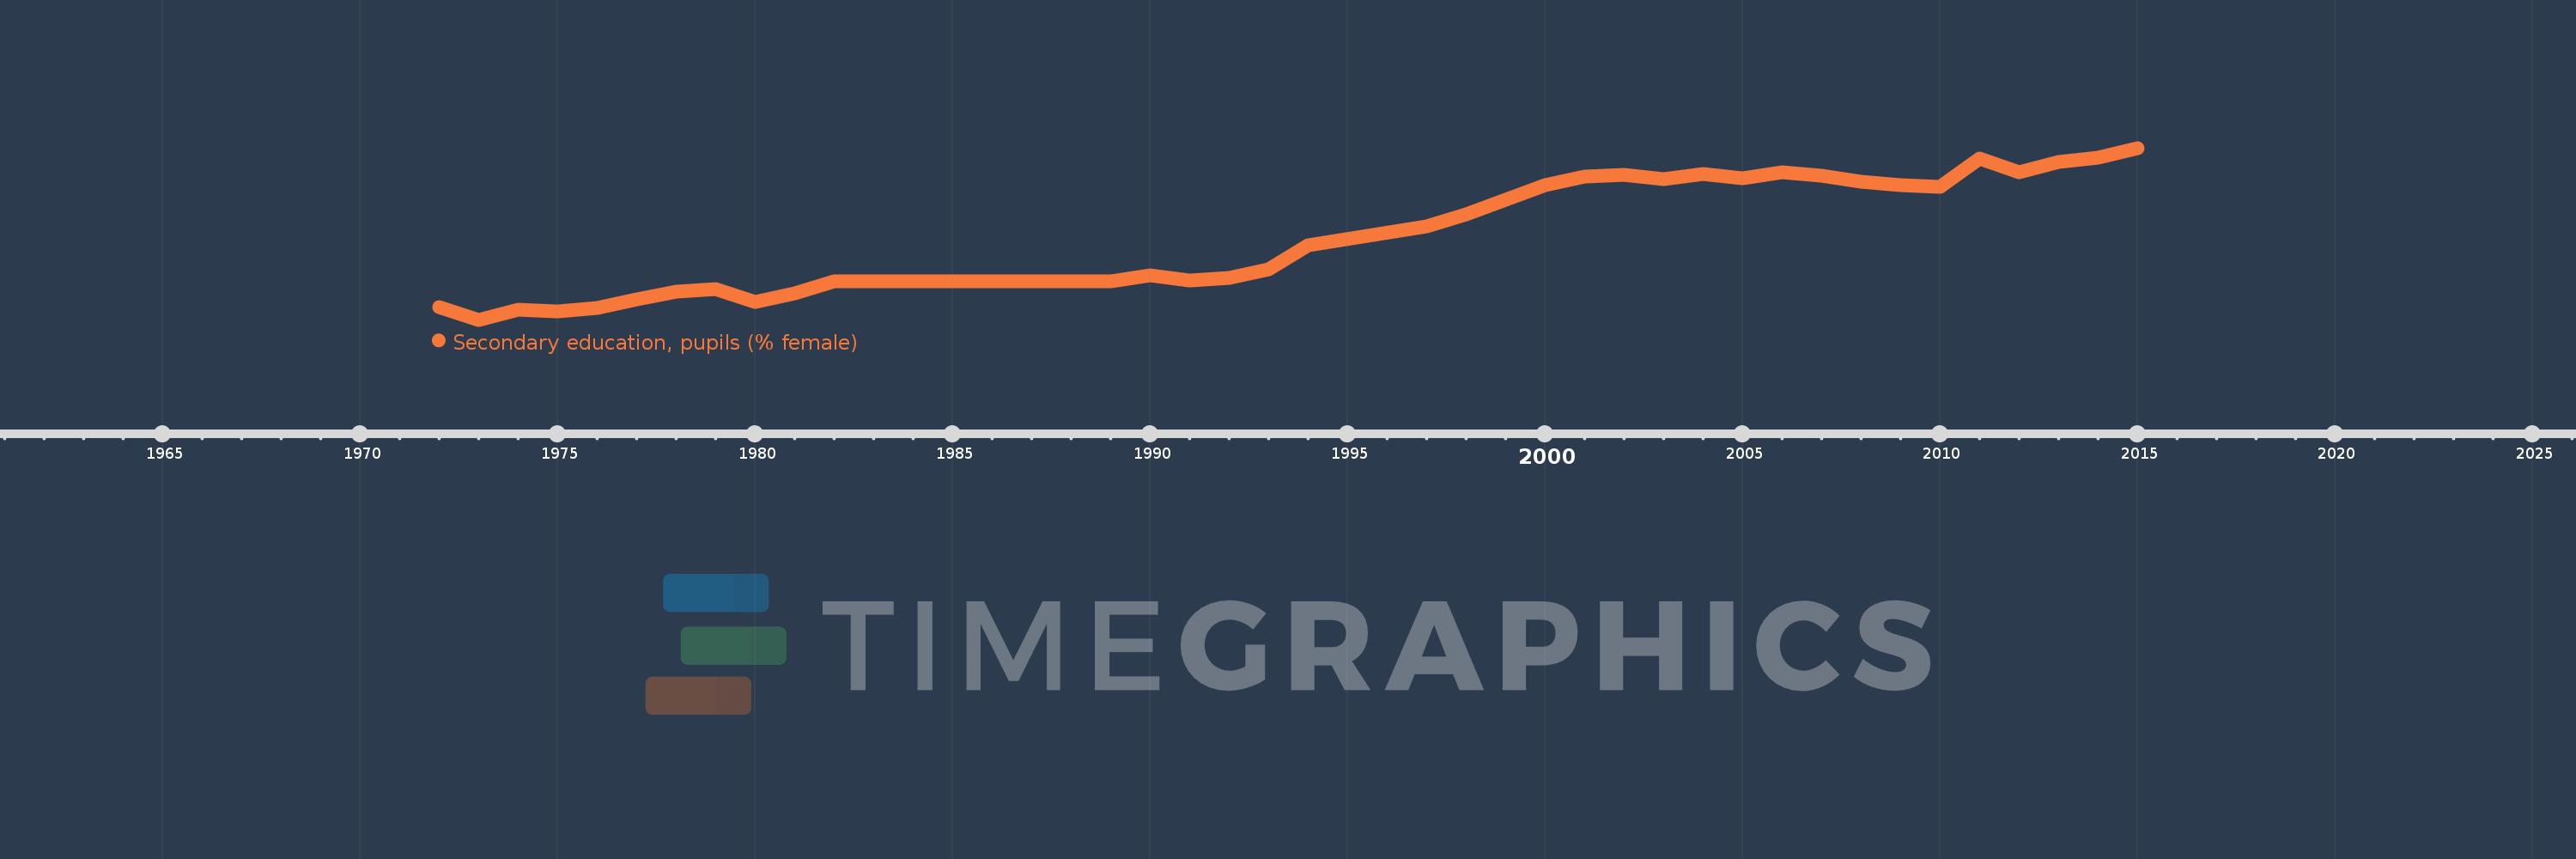
Secondary education, pupils (% female)
2015,2014,2013,2012,2011,2010,2009,2008,2007,2006,2005,2004,2003,2002,2001,2000,1999,1998,1997,1994,1993,1992,1991,1990,1989,1982,1981,1980,1979,1978,1977,1976,1975,1974,1973,1972
This statistics in other country:
AfghanistanAlbaniaAlgeriaAndorraAngolaAntigua and BarbudaArab WorldArgentinaArmeniaArubaAustraliaAustriaAzerbaijanBahamas, TheBahrainBangladeshBarbadosBelarusBelgiumBelizeBeninBermudaBhutanBoliviaBosnia and HerzegovinaBotswanaBrazilBritish Virgin IslandsBrunei DarussalamBulgariaBurkina FasoBurundiCabo VerdeCambodiaCameroonCanadaCaribbean small statesCayman IslandsCentral African RepublicCentral Europe and the BalticsChadChileChinaColombiaComorosCongo, Dem. Rep.Congo, Rep.Costa RicaCote d'IvoireCroatiaCubaCuracaoCyprusCzech RepublicDenmarkDjiboutiDominicaDominican RepublicEarly-demographic dividendEast Asia & PacificEast Asia & Pacific (excluding high income)East Asia & Pacific (IDA & IBRD countries)EcuadorEgypt, Arab Rep.El SalvadorEquatorial GuineaEritreaEstoniaEthiopiaEuro areaEurope & Central AsiaEurope & Central Asia (excluding high income)Europe & Central Asia (IDA & IBRD countries)European UnionFijiFinlandFragile and conflict affected situationsFranceGabonGambia, TheGeorgiaGermanyGhanaGibraltarGreeceGrenadaGuatemalaGuineaGuinea-BissauGuyanaHeavily indebted poor countries (HIPC)High incomeHondurasHong Kong SAR, ChinaHungaryIBRD onlyIcelandIDA & IBRD totalIDA blendIDA onlyIDA totalIndiaIndonesiaIran, Islamic Rep.IraqIrelandIsraelItalyJamaicaJapanJordanKazakhstanKenyaKiribatiKorea, Dem. People’s Rep.Korea, Rep.KuwaitKyrgyz RepublicLao PDRLate-demographic dividendLatin America & Caribbean Latin America & Caribbean (excluding high income)Latin America & the Caribbean (IDA & IBRD countries)LatviaLeast developed countries: UN classificationLebanonLesothoLiberiaLibyaLiechtensteinLithuaniaLow & middle incomeLow incomeLower middle incomeLuxembourgMacao SAR, ChinaMacedonia, FYRMadagascarMalawiMalaysiaMaldivesMaliMaltaMarshall IslandsMauritaniaMauritiusMexicoMicronesia, Fed. Sts.Middle East & North AfricaMiddle East & North Africa (excluding high income)Middle East & North Africa (IDA & IBRD countries)Middle incomeMoldovaMonacoMongoliaMontenegroMoroccoMozambiqueMyanmarNamibiaNauruNepalNetherlandsNew ZealandNicaraguaNigerNigeriaNorth AmericaNorwayOECD membersOmanOther small statesPacific island small statesPakistanPalauPanamaPapua New GuineaParaguayPeruPhilippinesPolandPortugalPost-demographic dividendPre-demographic dividendPuerto RicoQatarRomaniaRussian FederationRwandaSamoaSan MarinoSao Tome and PrincipeSaudi ArabiaSenegalSerbiaSeychellesSierra LeoneSingaporeSint Maarten (Dutch part)Slovak RepublicSloveniaSmall statesSolomon IslandsSomaliaSouth AfricaSouth AsiaSouth Asia (IDA & IBRD)SpainSri LankaSt. Kitts and NevisSt. LuciaSt. Vincent and the GrenadinesSub-Saharan Africa Sub-Saharan Africa (excluding high income)Sub-Saharan Africa (IDA & IBRD countries)SudanSurinameSwazilandSwedenSwitzerlandSyrian Arab RepublicTajikistanTanzaniaThailandTimor-LesteTogoTongaTrinidad and TobagoTunisiaTurkeyTurkmenistanTurks and Caicos IslandsTuvaluUgandaUkraineUnited Arab EmiratesUnited KingdomUnited StatesUpper middle incomeUruguayUzbekistanVanuatuVenezuela, RBVietnamWest Bank and GazaWorldYemen, Rep.ZambiaZimbabwe Timeline:
This timeline shows a graph from 1972 to 2015 of Niger. No data until 1971. Number of actual observations by date: 36.
Source name:
World Development Indicators
Source organization:
United Nations Educational, Scientific, and Cultural Organization (UNESCO) Institute for Statistics.
Categories, topics:
Education, Gender
Last updated:
apr 23, 2017
Indicators value changes by year
Minimum:
25.693
jan 1, 1973
Maximum:
41.322
jan 1, 2015
At the date of observation
Value
Absolute change
Change from previous value
jan 1, 1972
26.804
+26.804
0.0%
jan 1, 1973
25.693
-1.111
-4.15%
jan 1, 1974
26.618
+0.926
3.6%
jan 1, 1975
26.422
-0.196
-0.74%
jan 1, 1976
26.774
+0.351
1.33%
jan 1, 1977
27.541
+0.767
2.87%
jan 1, 1978
28.285
+0.744
2.7%
jan 1, 1979
28.479
+0.194
0.69%
jan 1, 1980
27.324
-1.155
-4.06%
jan 1, 1981
28.103
+0.779
2.85%
jan 1, 1982
29.165
+1.063
3.78%
jan 1, 1989
29.171
+0.006
0.02%
jan 1, 1990
29.769
+0.598
2.05%
jan 1, 1991
29.252
-0.518
-1.74%
jan 1, 1992
29.468
+0.216
0.74%
jan 1, 1993
30.307
+0.839
2.85%
jan 1, 1994
32.5
+2.193
7.24%
jan 1, 1997
34.151
+1.651
5.08%
jan 1, 1998
35.314
+1.163
3.4%
jan 1, 1999
36.594
+1.28
3.62%
jan 1, 2000
37.969
+1.375
3.76%
jan 1, 2001
38.695
+0.726
1.91%
jan 1, 2002
38.874
+0.179
0.46%
jan 1, 2003
38.46
-0.414
-1.07%
jan 1, 2004
38.917
+0.457
1.19%
jan 1, 2005
38.528
-0.389
-1.0%
jan 1, 2006
39.08
+0.553
1.43%
jan 1, 2007
38.779
-0.301
-0.77%
jan 1, 2008
38.234
-0.545
-1.41%
jan 1, 2009
37.918
-0.316
-0.83%
jan 1, 2010
37.757
-0.161
-0.43%
jan 1, 2011
40.348
+2.59
6.86%
jan 1, 2012
39.143
-1.205
-2.99%
jan 1, 2013
40.052
+0.909
2.32%
jan 1, 2014
40.442
+0.391
0.98%
jan 1, 2015
41.322
+0.88
2.18%
Ranking of countries by current statistics by years


Comments: