29
/
en
AIzaSyAYiBZKx7MnpbEhh9jyipgxe19OcubqV5w
April 1, 2024
157942
Iran, Islamic Rep.
IRN
true
2
1
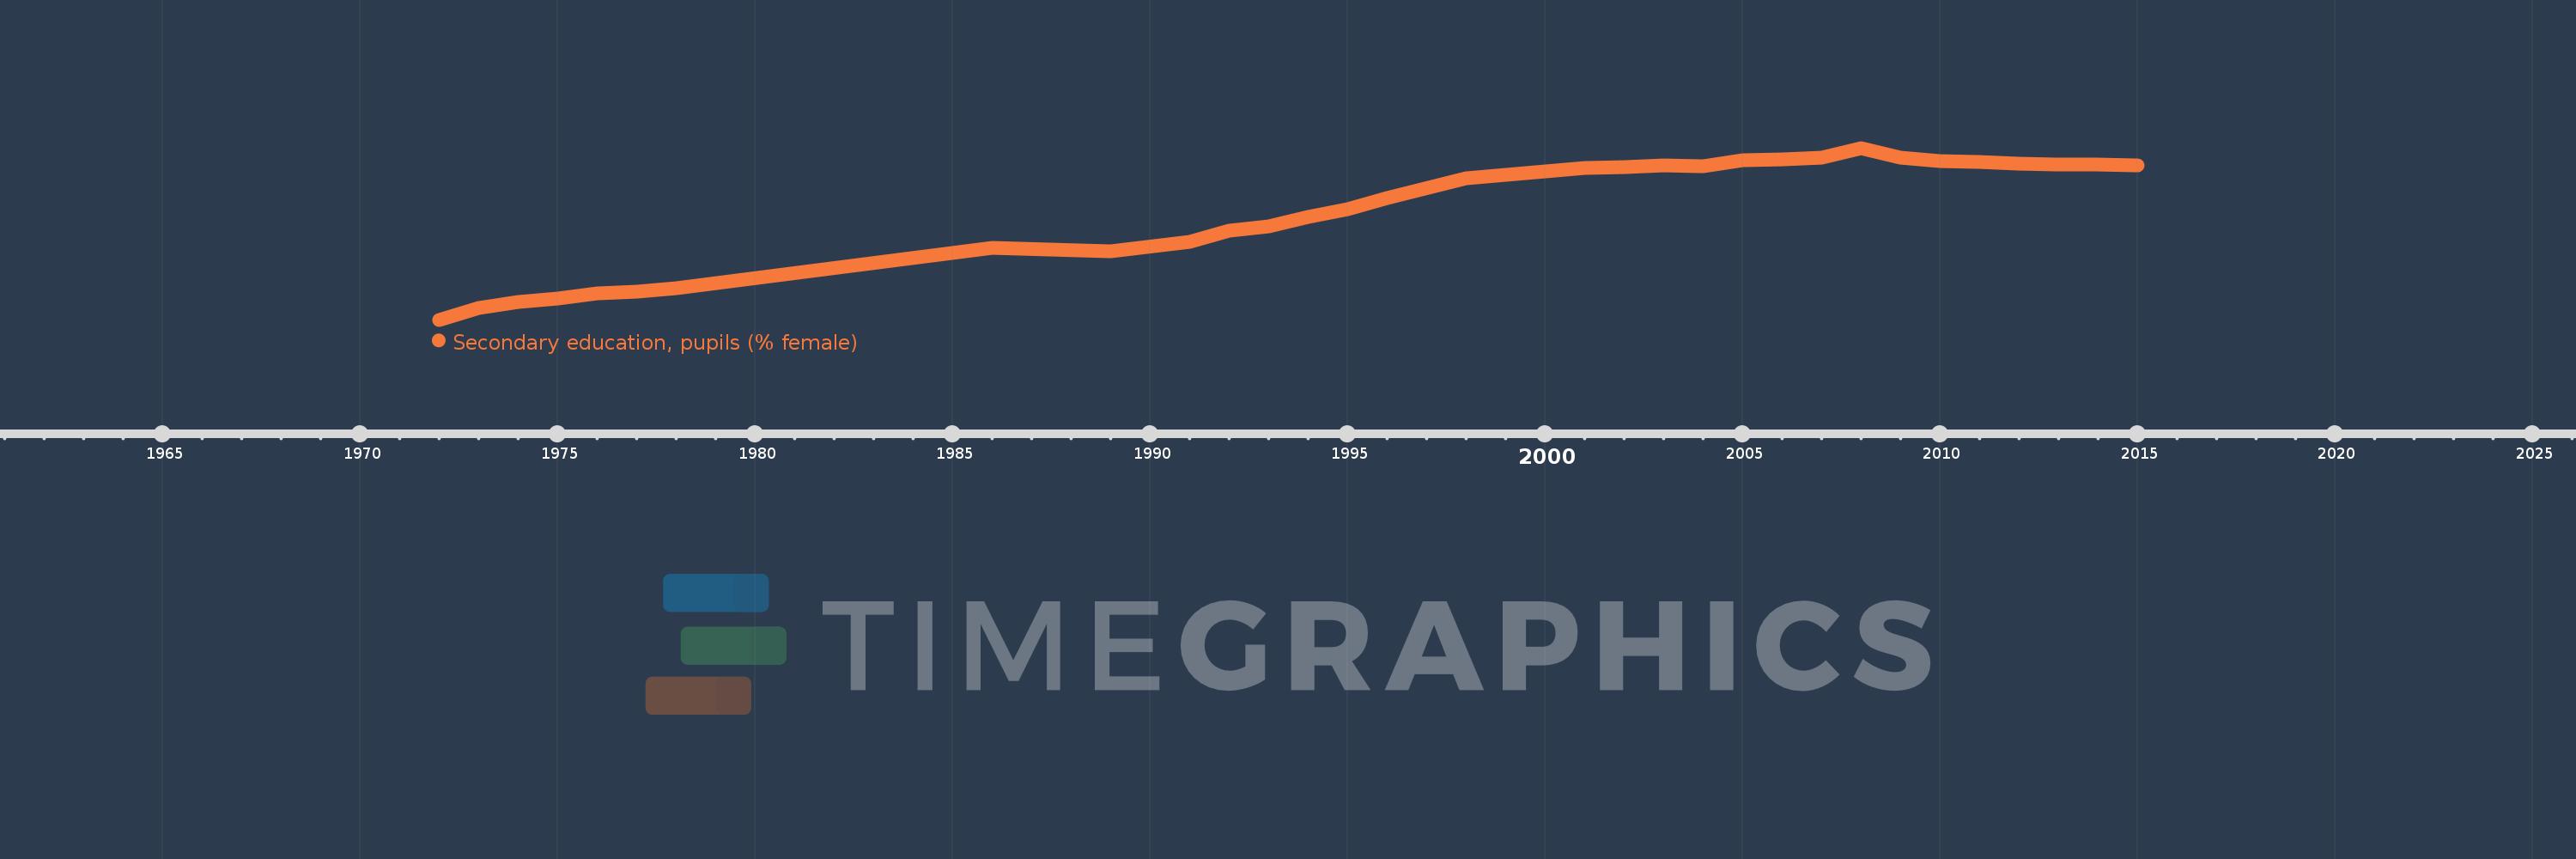
Secondary education, pupils (% female)
2015,2014,2013,2012,2011,2010,2009,2008,2007,2006,2005,2004,2003,2002,2001,2000,1998,1996,1995,1994,1993,1992,1991,1989,1986,1978,1977,1976,1975,1974,1973,1972
This statistics in other country:
AfghanistanAlbaniaAlgeriaAndorraAngolaAntigua and BarbudaArab WorldArgentinaArmeniaArubaAustraliaAustriaAzerbaijanBahamas, TheBahrainBangladeshBarbadosBelarusBelgiumBelizeBeninBermudaBhutanBoliviaBosnia and HerzegovinaBotswanaBrazilBritish Virgin IslandsBrunei DarussalamBulgariaBurkina FasoBurundiCabo VerdeCambodiaCameroonCanadaCaribbean small statesCayman IslandsCentral African RepublicCentral Europe and the BalticsChadChileChinaColombiaComorosCongo, Dem. Rep.Congo, Rep.Costa RicaCote d'IvoireCroatiaCubaCuracaoCyprusCzech RepublicDenmarkDjiboutiDominicaDominican RepublicEarly-demographic dividendEast Asia & PacificEast Asia & Pacific (excluding high income)East Asia & Pacific (IDA & IBRD countries)EcuadorEgypt, Arab Rep.El SalvadorEquatorial GuineaEritreaEstoniaEthiopiaEuro areaEurope & Central AsiaEurope & Central Asia (excluding high income)Europe & Central Asia (IDA & IBRD countries)European UnionFijiFinlandFragile and conflict affected situationsFranceGabonGambia, TheGeorgiaGermanyGhanaGibraltarGreeceGrenadaGuatemalaGuineaGuinea-BissauGuyanaHeavily indebted poor countries (HIPC)High incomeHondurasHong Kong SAR, ChinaHungaryIBRD onlyIcelandIDA & IBRD totalIDA blendIDA onlyIDA totalIndiaIndonesiaIran, Islamic Rep.IraqIrelandIsraelItalyJamaicaJapanJordanKazakhstanKenyaKiribatiKorea, Dem. People’s Rep.Korea, Rep.KuwaitKyrgyz RepublicLao PDRLate-demographic dividendLatin America & Caribbean Latin America & Caribbean (excluding high income)Latin America & the Caribbean (IDA & IBRD countries)LatviaLeast developed countries: UN classificationLebanonLesothoLiberiaLibyaLiechtensteinLithuaniaLow & middle incomeLow incomeLower middle incomeLuxembourgMacao SAR, ChinaMacedonia, FYRMadagascarMalawiMalaysiaMaldivesMaliMaltaMarshall IslandsMauritaniaMauritiusMexicoMicronesia, Fed. Sts.Middle East & North AfricaMiddle East & North Africa (excluding high income)Middle East & North Africa (IDA & IBRD countries)Middle incomeMoldovaMonacoMongoliaMontenegroMoroccoMozambiqueMyanmarNamibiaNauruNepalNetherlandsNew ZealandNicaraguaNigerNigeriaNorth AmericaNorwayOECD membersOmanOther small statesPacific island small statesPakistanPalauPanamaPapua New GuineaParaguayPeruPhilippinesPolandPortugalPost-demographic dividendPre-demographic dividendPuerto RicoQatarRomaniaRussian FederationRwandaSamoaSan MarinoSao Tome and PrincipeSaudi ArabiaSenegalSerbiaSeychellesSierra LeoneSingaporeSint Maarten (Dutch part)Slovak RepublicSloveniaSmall statesSolomon IslandsSomaliaSouth AfricaSouth AsiaSouth Asia (IDA & IBRD)SpainSri LankaSt. Kitts and NevisSt. LuciaSt. Vincent and the GrenadinesSub-Saharan Africa Sub-Saharan Africa (excluding high income)Sub-Saharan Africa (IDA & IBRD countries)SudanSurinameSwazilandSwedenSwitzerlandSyrian Arab RepublicTajikistanTanzaniaThailandTimor-LesteTogoTongaTrinidad and TobagoTunisiaTurkeyTurkmenistanTurks and Caicos IslandsTuvaluUgandaUkraineUnited Arab EmiratesUnited KingdomUnited StatesUpper middle incomeUruguayUzbekistanVanuatuVenezuela, RBVietnamWest Bank and GazaWorldYemen, Rep.ZambiaZimbabwe Timeline:
This timeline shows a graph from 1972 to 2015 of Iran, Islamic Rep.. No data until 1971. Number of actual observations by date: 32.
Source name:
World Development Indicators
Source organization:
United Nations Educational, Scientific, and Cultural Organization (UNESCO) Institute for Statistics.
Categories, topics:
Education, Gender
Last updated:
apr 23, 2017
Indicators value changes by year
Minimum:
33.032
jan 1, 1972
Maximum:
49.127
jan 1, 2008
At the date of observation
Value
Absolute change
Change from previous value
jan 1, 1972
33.032
+33.032
0.0%
jan 1, 1973
34.155
+1.123
3.4%
jan 1, 1974
34.715
+0.561
1.64%
jan 1, 1975
35.014
+0.299
0.86%
jan 1, 1976
35.468
+0.453
1.29%
jan 1, 1977
35.677
+0.209
0.59%
jan 1, 1978
36.008
+0.331
0.93%
jan 1, 1986
39.743
+3.735
10.37%
jan 1, 1989
39.411
-0.332
-0.84%
jan 1, 1991
40.327
+0.916
2.32%
jan 1, 1992
41.375
+1.048
2.6%
jan 1, 1993
41.775
+0.4
0.97%
jan 1, 1994
42.647
+0.872
2.09%
jan 1, 1995
43.415
+0.768
1.8%
jan 1, 1996
44.456
+1.041
2.4%
jan 1, 1998
46.318
+1.862
4.19%
jan 1, 2000
46.969
+0.651
1.41%
jan 1, 2001
47.251
+0.282
0.6%
jan 1, 2002
47.339
+0.088
0.19%
jan 1, 2003
47.52
+0.181
0.38%
jan 1, 2004
47.442
-0.078
-0.17%
jan 1, 2005
47.992
+0.55
1.16%
jan 1, 2006
48.062
+0.07
0.15%
jan 1, 2007
48.237
+0.175
0.36%
jan 1, 2008
49.127
+0.89
1.84%
jan 1, 2009
48.231
-0.895
-1.82%
jan 1, 2010
47.928
-0.304
-0.63%
jan 1, 2011
47.79
-0.138
-0.29%
jan 1, 2012
47.672
-0.119
-0.25%
jan 1, 2013
47.551
-0.12
-0.25%
jan 1, 2014
47.578
+0.027
0.06%
jan 1, 2015
47.523
-0.055
-0.12%
Ranking of countries by current statistics by years


Comments: