29
/
en
AIzaSyAYiBZKx7MnpbEhh9jyipgxe19OcubqV5w
April 1, 2024
133616
Finland
FIN
true
2
1
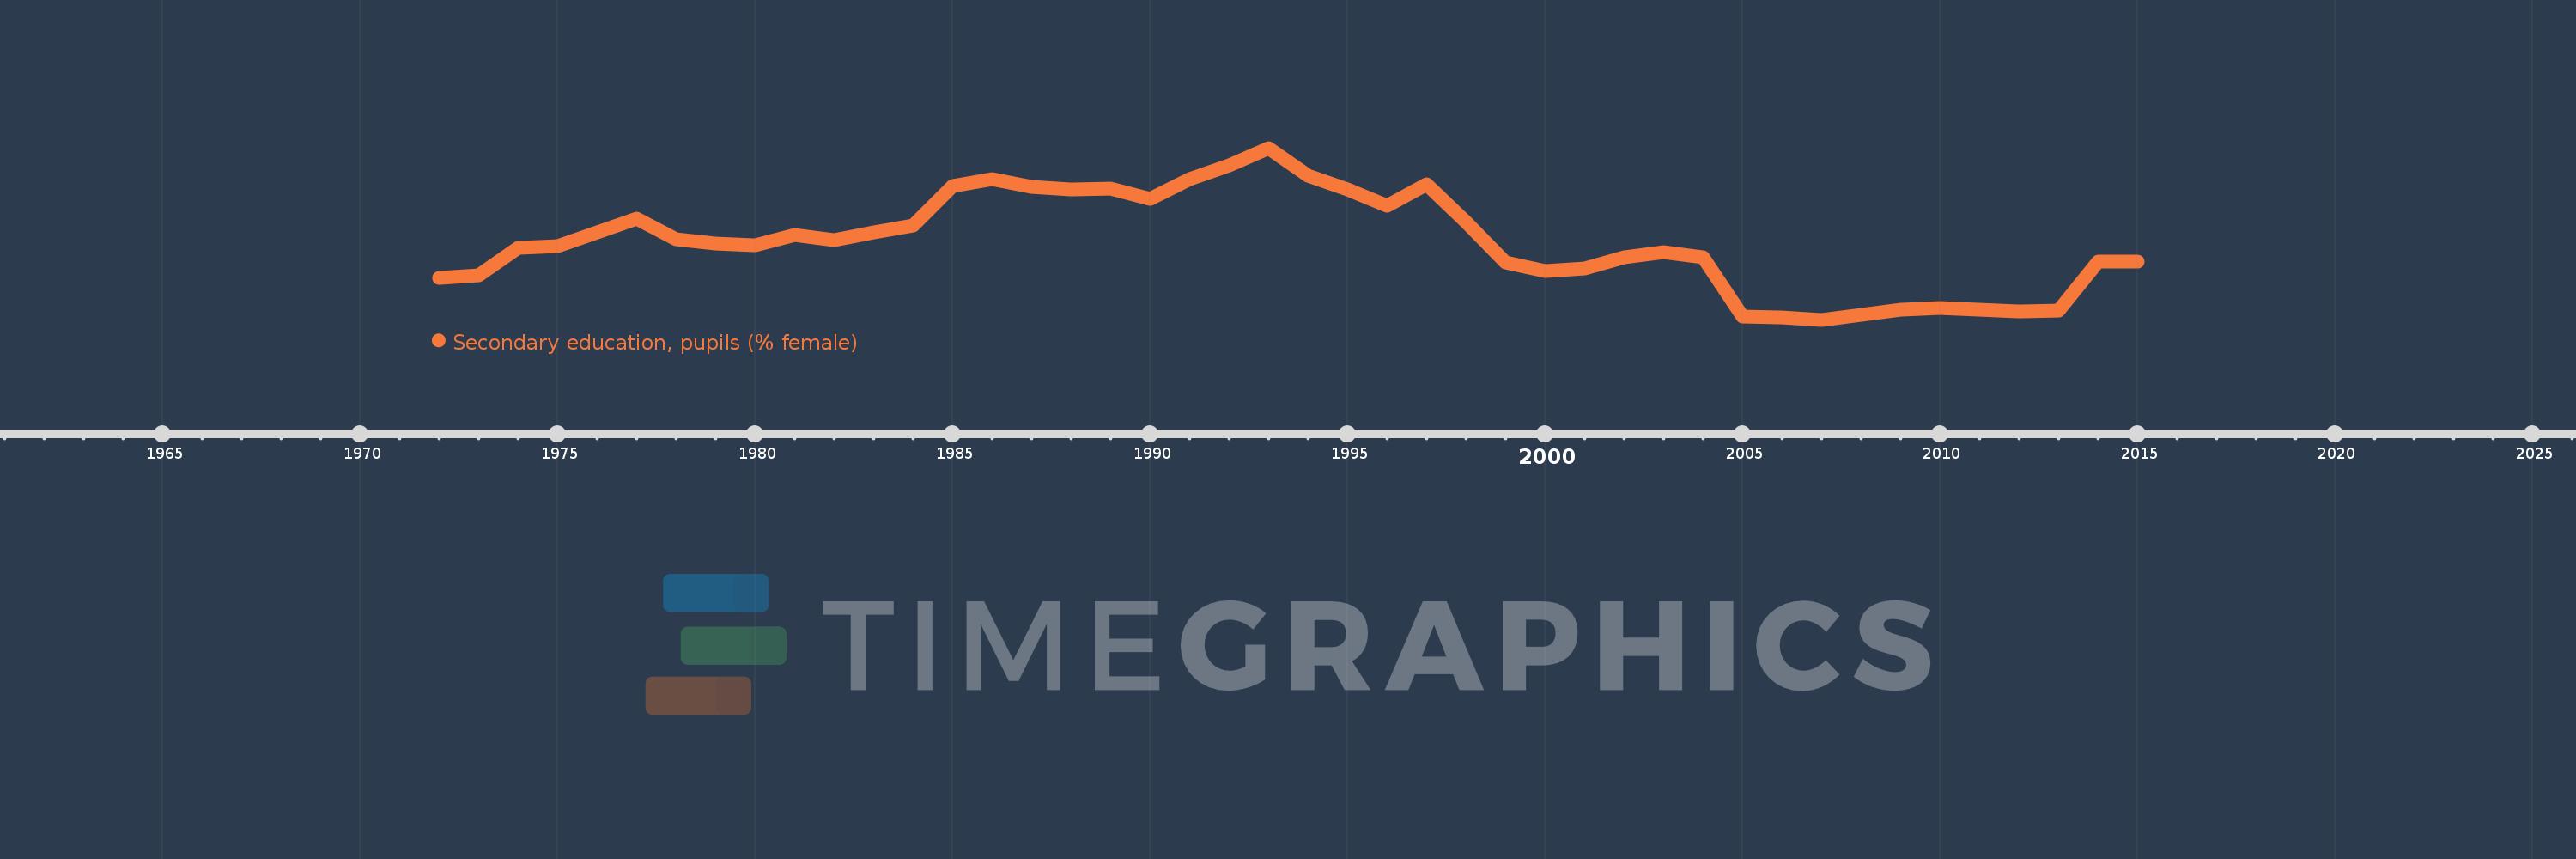
Secondary education, pupils (% female)
2015,2014,2013,2012,2011,2010,2009,2008,2007,2006,2005,2004,2003,2002,2001,2000,1999,1998,1997,1996,1995,1994,1993,1992,1991,1990,1989,1988,1987,1986,1985,1984,1983,1982,1981,1980,1979,1978,1977,1975,1974,1973,1972
This statistics in other country:
AfghanistanAlbaniaAlgeriaAndorraAngolaAntigua and BarbudaArab WorldArgentinaArmeniaArubaAustraliaAustriaAzerbaijanBahamas, TheBahrainBangladeshBarbadosBelarusBelgiumBelizeBeninBermudaBhutanBoliviaBosnia and HerzegovinaBotswanaBrazilBritish Virgin IslandsBrunei DarussalamBulgariaBurkina FasoBurundiCabo VerdeCambodiaCameroonCanadaCaribbean small statesCayman IslandsCentral African RepublicCentral Europe and the BalticsChadChileChinaColombiaComorosCongo, Dem. Rep.Congo, Rep.Costa RicaCote d'IvoireCroatiaCubaCuracaoCyprusCzech RepublicDenmarkDjiboutiDominicaDominican RepublicEarly-demographic dividendEast Asia & PacificEast Asia & Pacific (excluding high income)East Asia & Pacific (IDA & IBRD countries)EcuadorEgypt, Arab Rep.El SalvadorEquatorial GuineaEritreaEstoniaEthiopiaEuro areaEurope & Central AsiaEurope & Central Asia (excluding high income)Europe & Central Asia (IDA & IBRD countries)European UnionFijiFinlandFragile and conflict affected situationsFranceGabonGambia, TheGeorgiaGermanyGhanaGibraltarGreeceGrenadaGuatemalaGuineaGuinea-BissauGuyanaHeavily indebted poor countries (HIPC)High incomeHondurasHong Kong SAR, ChinaHungaryIBRD onlyIcelandIDA & IBRD totalIDA blendIDA onlyIDA totalIndiaIndonesiaIran, Islamic Rep.IraqIrelandIsraelItalyJamaicaJapanJordanKazakhstanKenyaKiribatiKorea, Dem. People’s Rep.Korea, Rep.KuwaitKyrgyz RepublicLao PDRLate-demographic dividendLatin America & Caribbean Latin America & Caribbean (excluding high income)Latin America & the Caribbean (IDA & IBRD countries)LatviaLeast developed countries: UN classificationLebanonLesothoLiberiaLibyaLiechtensteinLithuaniaLow & middle incomeLow incomeLower middle incomeLuxembourgMacao SAR, ChinaMacedonia, FYRMadagascarMalawiMalaysiaMaldivesMaliMaltaMarshall IslandsMauritaniaMauritiusMexicoMicronesia, Fed. Sts.Middle East & North AfricaMiddle East & North Africa (excluding high income)Middle East & North Africa (IDA & IBRD countries)Middle incomeMoldovaMonacoMongoliaMontenegroMoroccoMozambiqueMyanmarNamibiaNauruNepalNetherlandsNew ZealandNicaraguaNigerNigeriaNorth AmericaNorwayOECD membersOmanOther small statesPacific island small statesPakistanPalauPanamaPapua New GuineaParaguayPeruPhilippinesPolandPortugalPost-demographic dividendPre-demographic dividendPuerto RicoQatarRomaniaRussian FederationRwandaSamoaSan MarinoSao Tome and PrincipeSaudi ArabiaSenegalSerbiaSeychellesSierra LeoneSingaporeSint Maarten (Dutch part)Slovak RepublicSloveniaSmall statesSolomon IslandsSomaliaSouth AfricaSouth AsiaSouth Asia (IDA & IBRD)SpainSri LankaSt. Kitts and NevisSt. LuciaSt. Vincent and the GrenadinesSub-Saharan Africa Sub-Saharan Africa (excluding high income)Sub-Saharan Africa (IDA & IBRD countries)SudanSurinameSwazilandSwedenSwitzerlandSyrian Arab RepublicTajikistanTanzaniaThailandTimor-LesteTogoTongaTrinidad and TobagoTunisiaTurkeyTurkmenistanTurks and Caicos IslandsTuvaluUgandaUkraineUnited Arab EmiratesUnited KingdomUnited StatesUpper middle incomeUruguayUzbekistanVanuatuVenezuela, RBVietnamWest Bank and GazaWorldYemen, Rep.ZambiaZimbabwe Timeline:
This timeline shows a graph from 1972 to 2015 of Finland. No data until 1971. Number of actual observations by date: 43.
Source name:
World Development Indicators
Source organization:
United Nations Educational, Scientific, and Cultural Organization (UNESCO) Institute for Statistics.
Categories, topics:
Education, Gender
Last updated:
apr 23, 2017
Indicators value changes by year
Minimum:
49.971
jan 1, 2007
Maximum:
53.687
jan 1, 1993
At the date of observation
Value
Absolute change
Change from previous value
jan 1, 1972
50.87
+50.87
0.0%
jan 1, 1973
50.937
+0.067
0.13%
jan 1, 1974
51.533
+0.596
1.17%
jan 1, 1975
51.559
+0.026
0.05%
jan 1, 1977
52.151
+0.592
1.15%
jan 1, 1978
51.707
-0.444
-0.85%
jan 1, 1979
51.628
-0.079
-0.15%
jan 1, 1980
51.59
-0.038
-0.07%
jan 1, 1981
51.797
+0.207
0.4%
jan 1, 1982
51.688
-0.109
-0.21%
jan 1, 1983
51.853
+0.166
0.32%
jan 1, 1984
52.018
+0.164
0.32%
jan 1, 1985
52.856
+0.839
1.61%
jan 1, 1986
53.011
+0.154
0.29%
jan 1, 1987
52.85
-0.16
-0.3%
jan 1, 1988
52.796
-0.054
-0.1%
jan 1, 1989
52.802
+0.005
0.01%
jan 1, 1990
52.577
-0.225
-0.43%
jan 1, 1991
53.02
+0.444
0.84%
jan 1, 1992
53.304
+0.283
0.53%
jan 1, 1993
53.687
+0.383
0.72%
jan 1, 1994
53.084
-0.603
-1.12%
jan 1, 1995
52.788
-0.296
-0.56%
jan 1, 1996
52.434
-0.354
-0.67%
jan 1, 1997
52.896
+0.462
0.88%
jan 1, 1998
52.084
-0.812
-1.54%
jan 1, 1999
51.214
-0.87
-1.67%
jan 1, 2000
51.018
-0.196
-0.38%
jan 1, 2001
51.077
+0.059
0.12%
jan 1, 2002
51.316
+0.239
0.47%
jan 1, 2003
51.442
+0.126
0.25%
jan 1, 2004
51.321
-0.121
-0.24%
jan 1, 2005
50.045
-1.277
-2.49%
jan 1, 2006
50.015
-0.03
-0.06%
jan 1, 2007
49.971
-0.044
-0.09%
jan 1, 2008
50.086
+0.114
0.23%
jan 1, 2009
50.194
+0.109
0.22%
jan 1, 2010
50.233
+0.038
0.08%
jan 1, 2011
50.19
-0.043
-0.09%
jan 1, 2012
50.149
-0.042
-0.08%
jan 1, 2013
50.168
+0.02
0.04%
jan 1, 2014
51.228
+1.06
2.11%
jan 1, 2015
51.225
-0.003
-0.01%
Ranking of countries by current statistics by years


Comments: