29
/
en
AIzaSyAYiBZKx7MnpbEhh9jyipgxe19OcubqV5w
April 1, 2024
50454
Middle East & North Africa (IDA & IBRD countries)
TMN
false
2
1
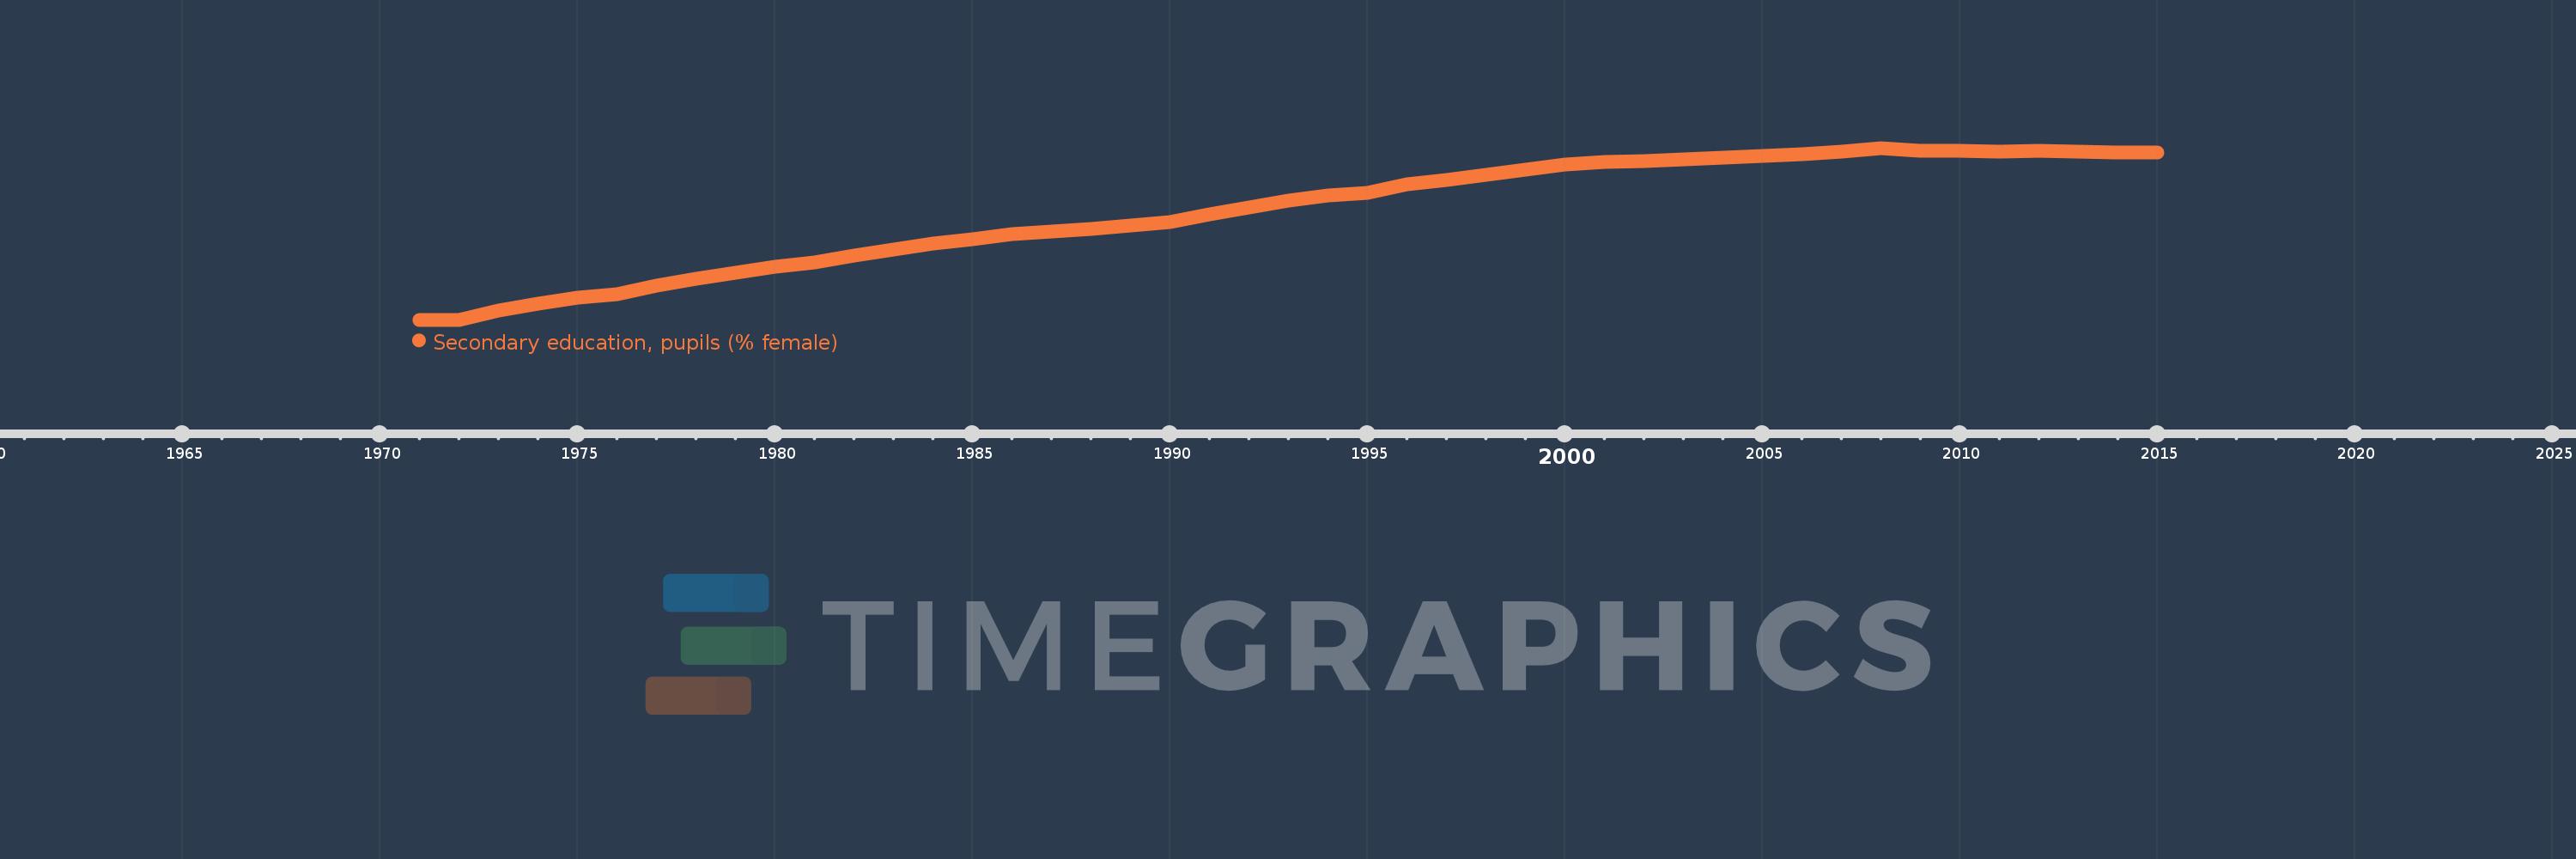
Secondary education, pupils (% female)
2015,2014,2013,2012,2011,2010,2009,2008,2007,2006,2005,2004,2003,2002,2001,2000,1999,1998,1997,1996,1995,1994,1993,1992,1991,1990,1989,1988,1987,1986,1985,1984,1983,1982,1981,1980,1979,1978,1977,1976,1975,1974,1973,1972,1971
This statistics in other country:
AfghanistanAlbaniaAlgeriaAndorraAngolaAntigua and BarbudaArab WorldArgentinaArmeniaArubaAustraliaAustriaAzerbaijanBahamas, TheBahrainBangladeshBarbadosBelarusBelgiumBelizeBeninBermudaBhutanBoliviaBosnia and HerzegovinaBotswanaBrazilBritish Virgin IslandsBrunei DarussalamBulgariaBurkina FasoBurundiCabo VerdeCambodiaCameroonCanadaCaribbean small statesCayman IslandsCentral African RepublicCentral Europe and the BalticsChadChileChinaColombiaComorosCongo, Dem. Rep.Congo, Rep.Costa RicaCote d'IvoireCroatiaCubaCuracaoCyprusCzech RepublicDenmarkDjiboutiDominicaDominican RepublicEarly-demographic dividendEast Asia & PacificEast Asia & Pacific (excluding high income)East Asia & Pacific (IDA & IBRD countries)EcuadorEgypt, Arab Rep.El SalvadorEquatorial GuineaEritreaEstoniaEthiopiaEuro areaEurope & Central AsiaEurope & Central Asia (excluding high income)Europe & Central Asia (IDA & IBRD countries)European UnionFijiFinlandFragile and conflict affected situationsFranceGabonGambia, TheGeorgiaGermanyGhanaGibraltarGreeceGrenadaGuatemalaGuineaGuinea-BissauGuyanaHeavily indebted poor countries (HIPC)High incomeHondurasHong Kong SAR, ChinaHungaryIBRD onlyIcelandIDA & IBRD totalIDA blendIDA onlyIDA totalIndiaIndonesiaIran, Islamic Rep.IraqIrelandIsraelItalyJamaicaJapanJordanKazakhstanKenyaKiribatiKorea, Dem. People’s Rep.Korea, Rep.KuwaitKyrgyz RepublicLao PDRLate-demographic dividendLatin America & Caribbean Latin America & Caribbean (excluding high income)Latin America & the Caribbean (IDA & IBRD countries)LatviaLeast developed countries: UN classificationLebanonLesothoLiberiaLibyaLiechtensteinLithuaniaLow & middle incomeLow incomeLower middle incomeLuxembourgMacao SAR, ChinaMacedonia, FYRMadagascarMalawiMalaysiaMaldivesMaliMaltaMarshall IslandsMauritaniaMauritiusMexicoMicronesia, Fed. Sts.Middle East & North AfricaMiddle East & North Africa (excluding high income)Middle East & North Africa (IDA & IBRD countries)Middle incomeMoldovaMonacoMongoliaMontenegroMoroccoMozambiqueMyanmarNamibiaNauruNepalNetherlandsNew ZealandNicaraguaNigerNigeriaNorth AmericaNorwayOECD membersOmanOther small statesPacific island small statesPakistanPalauPanamaPapua New GuineaParaguayPeruPhilippinesPolandPortugalPost-demographic dividendPre-demographic dividendPuerto RicoQatarRomaniaRussian FederationRwandaSamoaSan MarinoSao Tome and PrincipeSaudi ArabiaSenegalSerbiaSeychellesSierra LeoneSingaporeSint Maarten (Dutch part)Slovak RepublicSloveniaSmall statesSolomon IslandsSomaliaSouth AfricaSouth AsiaSouth Asia (IDA & IBRD)SpainSri LankaSt. Kitts and NevisSt. LuciaSt. Vincent and the GrenadinesSub-Saharan Africa Sub-Saharan Africa (excluding high income)Sub-Saharan Africa (IDA & IBRD countries)SudanSurinameSwazilandSwedenSwitzerlandSyrian Arab RepublicTajikistanTanzaniaThailandTimor-LesteTogoTongaTrinidad and TobagoTunisiaTurkeyTurkmenistanTurks and Caicos IslandsTuvaluUgandaUkraineUnited Arab EmiratesUnited KingdomUnited StatesUpper middle incomeUruguayUzbekistanVanuatuVenezuela, RBVietnamWest Bank and GazaWorldYemen, Rep.ZambiaZimbabwe Timeline:
This timeline shows a graph from 1971 to 2015 of Middle East & North Africa (IDA & IBRD countries). No data until 1970. Number of actual observations by date: 45.
Source name:
World Development Indicators
Source organization:
United Nations Educational, Scientific, and Cultural Organization (UNESCO) Institute for Statistics.
Categories, topics:
Education, Gender
Last updated:
apr 23, 2017
Indicators value changes by year
Minimum:
30.739
jan 1, 1971
Maximum:
47.743
jan 1, 2008
At the date of observation
Value
Absolute change
Change from previous value
jan 1, 1971
30.739
+30.739
0.0%
jan 1, 1972
30.742
+0.003
0.01%
jan 1, 1973
31.676
+0.934
3.04%
jan 1, 1974
32.339
+0.662
2.09%
jan 1, 1975
32.964
+0.625
1.93%
jan 1, 1976
33.291
+0.327
0.99%
jan 1, 1977
34.086
+0.795
2.39%
jan 1, 1978
34.829
+0.742
2.18%
jan 1, 1979
35.376
+0.547
1.57%
jan 1, 1980
35.989
+0.613
1.73%
jan 1, 1981
36.418
+0.43
1.19%
jan 1, 1982
37.055
+0.637
1.75%
jan 1, 1983
37.644
+0.589
1.59%
jan 1, 1984
38.246
+0.602
1.6%
jan 1, 1985
38.699
+0.453
1.18%
jan 1, 1986
39.174
+0.475
1.23%
jan 1, 1987
39.454
+0.28
0.72%
jan 1, 1988
39.735
+0.28
0.71%
jan 1, 1989
40.057
+0.322
0.81%
jan 1, 1990
40.439
+0.382
0.95%
jan 1, 1991
41.199
+0.76
1.88%
jan 1, 1992
41.866
+0.666
1.62%
jan 1, 1993
42.504
+0.639
1.53%
jan 1, 1994
43.006
+0.502
1.18%
jan 1, 1995
43.336
+0.33
0.77%
jan 1, 1996
44.118
+0.782
1.8%
jan 1, 1997
44.54
+0.422
0.96%
jan 1, 1998
45.1
+0.56
1.26%
jan 1, 1999
45.59
+0.49
1.09%
jan 1, 2000
46.078
+0.488
1.07%
jan 1, 2001
46.351
+0.272
0.59%
jan 1, 2002
46.454
+0.103
0.22%
jan 1, 2003
46.605
+0.151
0.33%
jan 1, 2004
46.799
+0.194
0.42%
jan 1, 2005
46.951
+0.153
0.33%
jan 1, 2006
47.158
+0.207
0.44%
jan 1, 2007
47.36
+0.202
0.43%
jan 1, 2008
47.743
+0.383
0.81%
jan 1, 2009
47.49
-0.253
-0.53%
jan 1, 2010
47.421
-0.069
-0.15%
jan 1, 2011
47.408
-0.013
-0.03%
jan 1, 2012
47.429
+0.022
0.05%
jan 1, 2013
47.348
-0.081
-0.17%
jan 1, 2014
47.273
-0.075
-0.16%
jan 1, 2015
47.327
+0.054
0.11%
Ranking of countries by current statistics by years


Comments: