29
/
en
AIzaSyAYiBZKx7MnpbEhh9jyipgxe19OcubqV5w
April 1, 2024
159882
Ireland
IRL
true
2
1
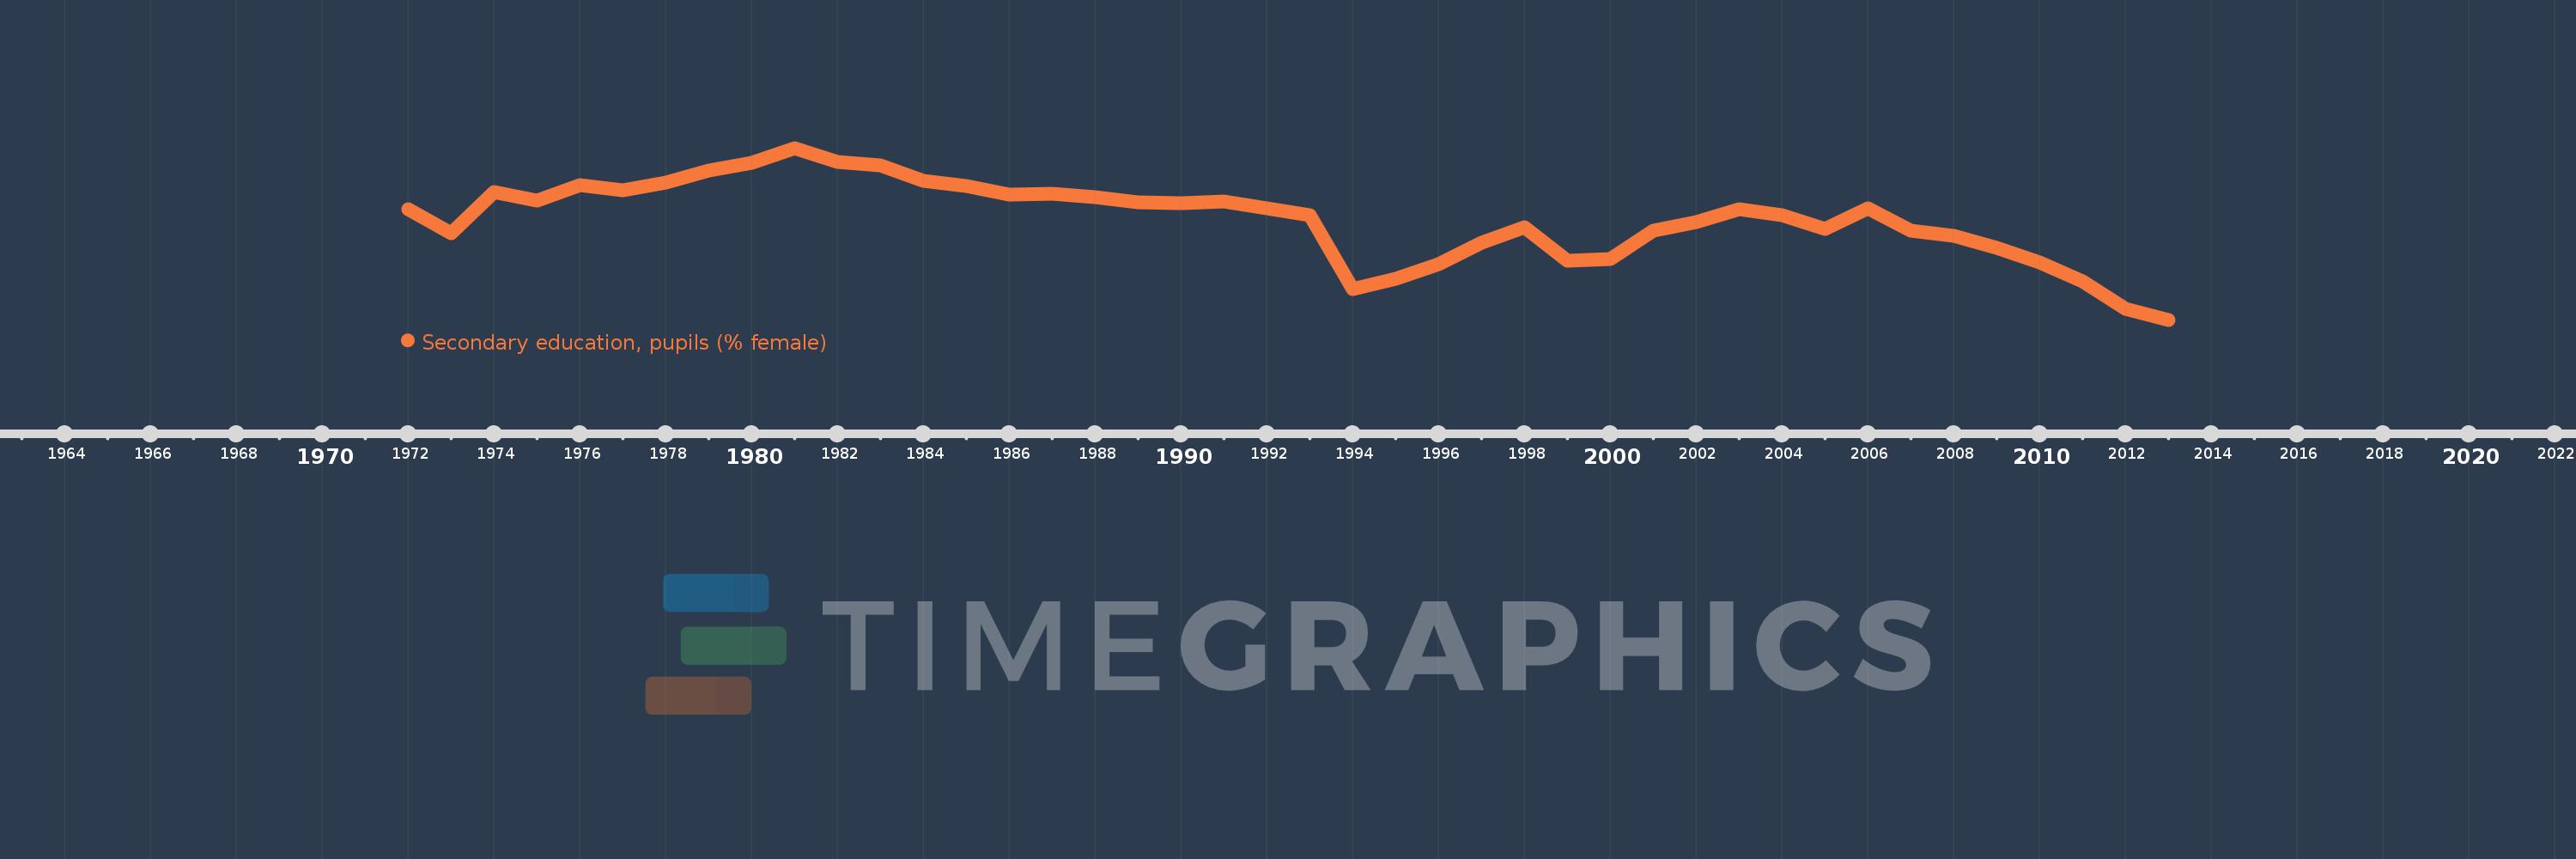
Secondary education, pupils (% female)
2013,2012,2011,2010,2009,2008,2007,2006,2005,2004,2003,2002,2001,2000,1999,1998,1997,1996,1995,1994,1993,1992,1991,1990,1989,1988,1987,1986,1985,1984,1983,1982,1981,1980,1979,1978,1977,1976,1975,1974,1973,1972
This statistics in other country:
AfghanistanAlbaniaAlgeriaAndorraAngolaAntigua and BarbudaArab WorldArgentinaArmeniaArubaAustraliaAustriaAzerbaijanBahamas, TheBahrainBangladeshBarbadosBelarusBelgiumBelizeBeninBermudaBhutanBoliviaBosnia and HerzegovinaBotswanaBrazilBritish Virgin IslandsBrunei DarussalamBulgariaBurkina FasoBurundiCabo VerdeCambodiaCameroonCanadaCaribbean small statesCayman IslandsCentral African RepublicCentral Europe and the BalticsChadChileChinaColombiaComorosCongo, Dem. Rep.Congo, Rep.Costa RicaCote d'IvoireCroatiaCubaCuracaoCyprusCzech RepublicDenmarkDjiboutiDominicaDominican RepublicEarly-demographic dividendEast Asia & PacificEast Asia & Pacific (excluding high income)East Asia & Pacific (IDA & IBRD countries)EcuadorEgypt, Arab Rep.El SalvadorEquatorial GuineaEritreaEstoniaEthiopiaEuro areaEurope & Central AsiaEurope & Central Asia (excluding high income)Europe & Central Asia (IDA & IBRD countries)European UnionFijiFinlandFragile and conflict affected situationsFranceGabonGambia, TheGeorgiaGermanyGhanaGibraltarGreeceGrenadaGuatemalaGuineaGuinea-BissauGuyanaHeavily indebted poor countries (HIPC)High incomeHondurasHong Kong SAR, ChinaHungaryIBRD onlyIcelandIDA & IBRD totalIDA blendIDA onlyIDA totalIndiaIndonesiaIran, Islamic Rep.IraqIrelandIsraelItalyJamaicaJapanJordanKazakhstanKenyaKiribatiKorea, Dem. People’s Rep.Korea, Rep.KuwaitKyrgyz RepublicLao PDRLate-demographic dividendLatin America & Caribbean Latin America & Caribbean (excluding high income)Latin America & the Caribbean (IDA & IBRD countries)LatviaLeast developed countries: UN classificationLebanonLesothoLiberiaLibyaLiechtensteinLithuaniaLow & middle incomeLow incomeLower middle incomeLuxembourgMacao SAR, ChinaMacedonia, FYRMadagascarMalawiMalaysiaMaldivesMaliMaltaMarshall IslandsMauritaniaMauritiusMexicoMicronesia, Fed. Sts.Middle East & North AfricaMiddle East & North Africa (excluding high income)Middle East & North Africa (IDA & IBRD countries)Middle incomeMoldovaMonacoMongoliaMontenegroMoroccoMozambiqueMyanmarNamibiaNauruNepalNetherlandsNew ZealandNicaraguaNigerNigeriaNorth AmericaNorwayOECD membersOmanOther small statesPacific island small statesPakistanPalauPanamaPapua New GuineaParaguayPeruPhilippinesPolandPortugalPost-demographic dividendPre-demographic dividendPuerto RicoQatarRomaniaRussian FederationRwandaSamoaSan MarinoSao Tome and PrincipeSaudi ArabiaSenegalSerbiaSeychellesSierra LeoneSingaporeSint Maarten (Dutch part)Slovak RepublicSloveniaSmall statesSolomon IslandsSomaliaSouth AfricaSouth AsiaSouth Asia (IDA & IBRD)SpainSri LankaSt. Kitts and NevisSt. LuciaSt. Vincent and the GrenadinesSub-Saharan Africa Sub-Saharan Africa (excluding high income)Sub-Saharan Africa (IDA & IBRD countries)SudanSurinameSwazilandSwedenSwitzerlandSyrian Arab RepublicTajikistanTanzaniaThailandTimor-LesteTogoTongaTrinidad and TobagoTunisiaTurkeyTurkmenistanTurks and Caicos IslandsTuvaluUgandaUkraineUnited Arab EmiratesUnited KingdomUnited StatesUpper middle incomeUruguayUzbekistanVanuatuVenezuela, RBVietnamWest Bank and GazaWorldYemen, Rep.ZambiaZimbabwe Timeline:
This timeline shows a graph from 1972 to 2013 of Ireland. No data until 1971. Number of actual observations by date: 42.
Source name:
World Development Indicators
Source organization:
United Nations Educational, Scientific, and Cultural Organization (UNESCO) Institute for Statistics.
Categories, topics:
Education, Gender
Last updated:
apr 23, 2017
Indicators value changes by year
Minimum:
49.302
jan 1, 2013
Maximum:
51.879
jan 1, 1981
At the date of observation
Value
Absolute change
Change from previous value
jan 1, 1972
50.962
+50.962
0.0%
jan 1, 1973
50.599
-0.363
-0.71%
jan 1, 1974
51.212
+0.613
1.21%
jan 1, 1975
51.095
-0.116
-0.23%
jan 1, 1976
51.316
+0.221
0.43%
jan 1, 1977
51.245
-0.071
-0.14%
jan 1, 1978
51.363
+0.118
0.23%
jan 1, 1979
51.538
+0.175
0.34%
jan 1, 1980
51.657
+0.119
0.23%
jan 1, 1981
51.879
+0.222
0.43%
jan 1, 1982
51.665
-0.214
-0.41%
jan 1, 1983
51.612
-0.052
-0.1%
jan 1, 1984
51.383
-0.23
-0.44%
jan 1, 1985
51.312
-0.071
-0.14%
jan 1, 1986
51.176
-0.136
-0.26%
jan 1, 1987
51.191
+0.015
0.03%
jan 1, 1988
51.144
-0.047
-0.09%
jan 1, 1989
51.066
-0.079
-0.15%
jan 1, 1990
51.051
-0.014
-0.03%
jan 1, 1991
51.078
+0.027
0.05%
jan 1, 1992
50.973
-0.105
-0.21%
jan 1, 1993
50.871
-0.102
-0.2%
jan 1, 1994
49.763
-1.108
-2.18%
jan 1, 1995
49.912
+0.149
0.3%
jan 1, 1996
50.135
+0.223
0.45%
jan 1, 1997
50.453
+0.318
0.63%
jan 1, 1998
50.696
+0.243
0.48%
jan 1, 1999
50.192
-0.504
-0.99%
jan 1, 2000
50.215
+0.022
0.04%
jan 1, 2001
50.64
+0.425
0.85%
jan 1, 2002
50.773
+0.134
0.26%
jan 1, 2003
50.955
+0.181
0.36%
jan 1, 2004
50.874
-0.081
-0.16%
jan 1, 2005
50.666
-0.208
-0.41%
jan 1, 2006
50.971
+0.305
0.6%
jan 1, 2007
50.638
-0.333
-0.65%
jan 1, 2008
50.563
-0.075
-0.15%
jan 1, 2009
50.375
-0.188
-0.37%
jan 1, 2010
50.156
-0.219
-0.43%
jan 1, 2011
49.882
-0.274
-0.55%
jan 1, 2012
49.461
-0.421
-0.84%
jan 1, 2013
49.302
-0.16
-0.32%
Ranking of countries by current statistics by years


Comments: