29
/
en
AIzaSyAYiBZKx7MnpbEhh9jyipgxe19OcubqV5w
April 1, 2024
105444
Chile
CHL
true
2
1
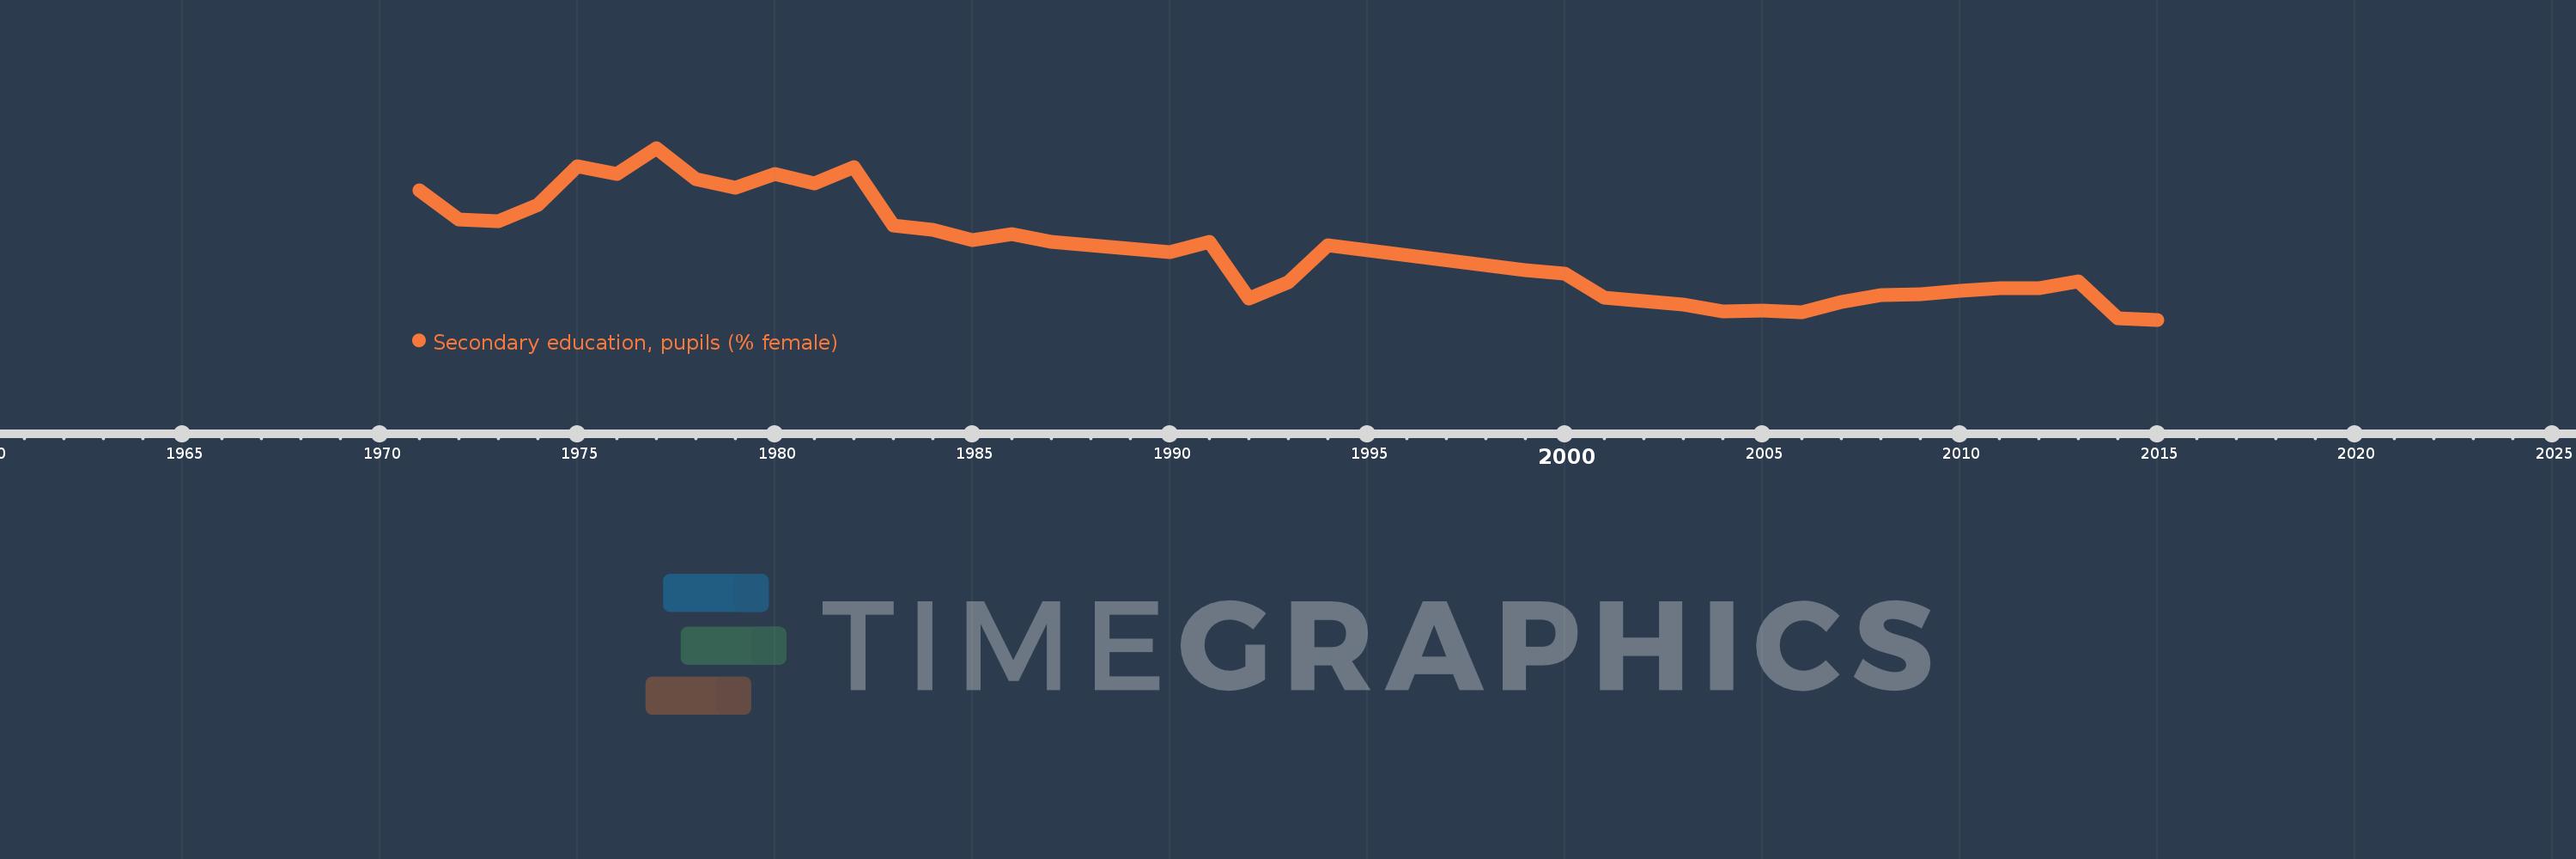
Secondary education, pupils (% female)
2015,2014,2013,2012,2011,2010,2009,2008,2007,2006,2005,2004,2003,2001,2000,1999,1994,1993,1992,1991,1990,1987,1986,1985,1984,1983,1982,1981,1980,1979,1978,1977,1976,1975,1974,1973,1972,1971
This statistics in other country:
AfghanistanAlbaniaAlgeriaAndorraAngolaAntigua and BarbudaArab WorldArgentinaArmeniaArubaAustraliaAustriaAzerbaijanBahamas, TheBahrainBangladeshBarbadosBelarusBelgiumBelizeBeninBermudaBhutanBoliviaBosnia and HerzegovinaBotswanaBrazilBritish Virgin IslandsBrunei DarussalamBulgariaBurkina FasoBurundiCabo VerdeCambodiaCameroonCanadaCaribbean small statesCayman IslandsCentral African RepublicCentral Europe and the BalticsChadChileChinaColombiaComorosCongo, Dem. Rep.Congo, Rep.Costa RicaCote d'IvoireCroatiaCubaCuracaoCyprusCzech RepublicDenmarkDjiboutiDominicaDominican RepublicEarly-demographic dividendEast Asia & PacificEast Asia & Pacific (excluding high income)East Asia & Pacific (IDA & IBRD countries)EcuadorEgypt, Arab Rep.El SalvadorEquatorial GuineaEritreaEstoniaEthiopiaEuro areaEurope & Central AsiaEurope & Central Asia (excluding high income)Europe & Central Asia (IDA & IBRD countries)European UnionFijiFinlandFragile and conflict affected situationsFranceGabonGambia, TheGeorgiaGermanyGhanaGibraltarGreeceGrenadaGuatemalaGuineaGuinea-BissauGuyanaHeavily indebted poor countries (HIPC)High incomeHondurasHong Kong SAR, ChinaHungaryIBRD onlyIcelandIDA & IBRD totalIDA blendIDA onlyIDA totalIndiaIndonesiaIran, Islamic Rep.IraqIrelandIsraelItalyJamaicaJapanJordanKazakhstanKenyaKiribatiKorea, Dem. People’s Rep.Korea, Rep.KuwaitKyrgyz RepublicLao PDRLate-demographic dividendLatin America & Caribbean Latin America & Caribbean (excluding high income)Latin America & the Caribbean (IDA & IBRD countries)LatviaLeast developed countries: UN classificationLebanonLesothoLiberiaLibyaLiechtensteinLithuaniaLow & middle incomeLow incomeLower middle incomeLuxembourgMacao SAR, ChinaMacedonia, FYRMadagascarMalawiMalaysiaMaldivesMaliMaltaMarshall IslandsMauritaniaMauritiusMexicoMicronesia, Fed. Sts.Middle East & North AfricaMiddle East & North Africa (excluding high income)Middle East & North Africa (IDA & IBRD countries)Middle incomeMoldovaMonacoMongoliaMontenegroMoroccoMozambiqueMyanmarNamibiaNauruNepalNetherlandsNew ZealandNicaraguaNigerNigeriaNorth AmericaNorwayOECD membersOmanOther small statesPacific island small statesPakistanPalauPanamaPapua New GuineaParaguayPeruPhilippinesPolandPortugalPost-demographic dividendPre-demographic dividendPuerto RicoQatarRomaniaRussian FederationRwandaSamoaSan MarinoSao Tome and PrincipeSaudi ArabiaSenegalSerbiaSeychellesSierra LeoneSingaporeSint Maarten (Dutch part)Slovak RepublicSloveniaSmall statesSolomon IslandsSomaliaSouth AfricaSouth AsiaSouth Asia (IDA & IBRD)SpainSri LankaSt. Kitts and NevisSt. LuciaSt. Vincent and the GrenadinesSub-Saharan Africa Sub-Saharan Africa (excluding high income)Sub-Saharan Africa (IDA & IBRD countries)SudanSurinameSwazilandSwedenSwitzerlandSyrian Arab RepublicTajikistanTanzaniaThailandTimor-LesteTogoTongaTrinidad and TobagoTunisiaTurkeyTurkmenistanTurks and Caicos IslandsTuvaluUgandaUkraineUnited Arab EmiratesUnited KingdomUnited StatesUpper middle incomeUruguayUzbekistanVanuatuVenezuela, RBVietnamWest Bank and GazaWorldYemen, Rep.ZambiaZimbabwe Timeline:
This timeline shows a graph from 1971 to 2015 of Chile. No data until 1970. Number of actual observations by date: 38.
Source name:
World Development Indicators
Source organization:
United Nations Educational, Scientific, and Cultural Organization (UNESCO) Institute for Statistics.
Categories, topics:
Education, Gender
Last updated:
apr 23, 2017
Indicators value changes by year
Maximum:
52.297
jan 1, 1977
At the date of observation
Value
Absolute change
Change from previous value
jan 1, 1971
51.57
+51.57
0.0%
jan 1, 1972
51.059
-0.511
-0.99%
jan 1, 1973
51.031
-0.028
-0.05%
jan 1, 1974
51.31
+0.278
0.55%
jan 1, 1975
51.975
+0.665
1.3%
jan 1, 1976
51.849
-0.126
-0.24%
jan 1, 1977
52.297
+0.449
0.87%
jan 1, 1978
51.763
-0.534
-1.02%
jan 1, 1979
51.619
-0.144
-0.28%
jan 1, 1980
51.853
+0.234
0.45%
jan 1, 1981
51.688
-0.165
-0.32%
jan 1, 1982
51.961
+0.274
0.53%
jan 1, 1983
50.961
-1.0
-1.92%
jan 1, 1984
50.892
-0.069
-0.14%
jan 1, 1985
50.707
-0.185
-0.36%
jan 1, 1986
50.812
+0.105
0.21%
jan 1, 1987
50.685
-0.127
-0.25%
jan 1, 1990
50.504
-0.181
-0.36%
jan 1, 1991
50.674
+0.17
0.34%
jan 1, 1992
49.71
-0.964
-1.9%
jan 1, 1993
49.993
+0.282
0.57%
jan 1, 1994
50.625
+0.632
1.26%
jan 1, 1999
50.196
-0.429
-0.85%
jan 1, 2000
50.13
-0.066
-0.13%
jan 1, 2001
49.724
-0.407
-0.81%
jan 1, 2003
49.595
-0.129
-0.26%
jan 1, 2004
49.477
-0.118
-0.24%
jan 1, 2005
49.5
+0.023
0.05%
jan 1, 2006
49.462
-0.038
-0.08%
jan 1, 2007
49.642
+0.18
0.36%
jan 1, 2008
49.767
+0.125
0.25%
jan 1, 2009
49.777
+0.01
0.02%
jan 1, 2010
49.845
+0.068
0.14%
jan 1, 2011
49.879
+0.034
0.07%
jan 1, 2012
49.88
+0.002
0.0%
jan 1, 2013
50.001
+0.121
0.24%
jan 1, 2014
49.371
-0.629
-1.26%
jan 1, 2015
49.34
-0.031
-0.06%
Ranking of countries by current statistics by years


Comments: