29
/
en
AIzaSyAYiBZKx7MnpbEhh9jyipgxe19OcubqV5w
April 1, 2024
65420
Albania
ALB
true
2
1
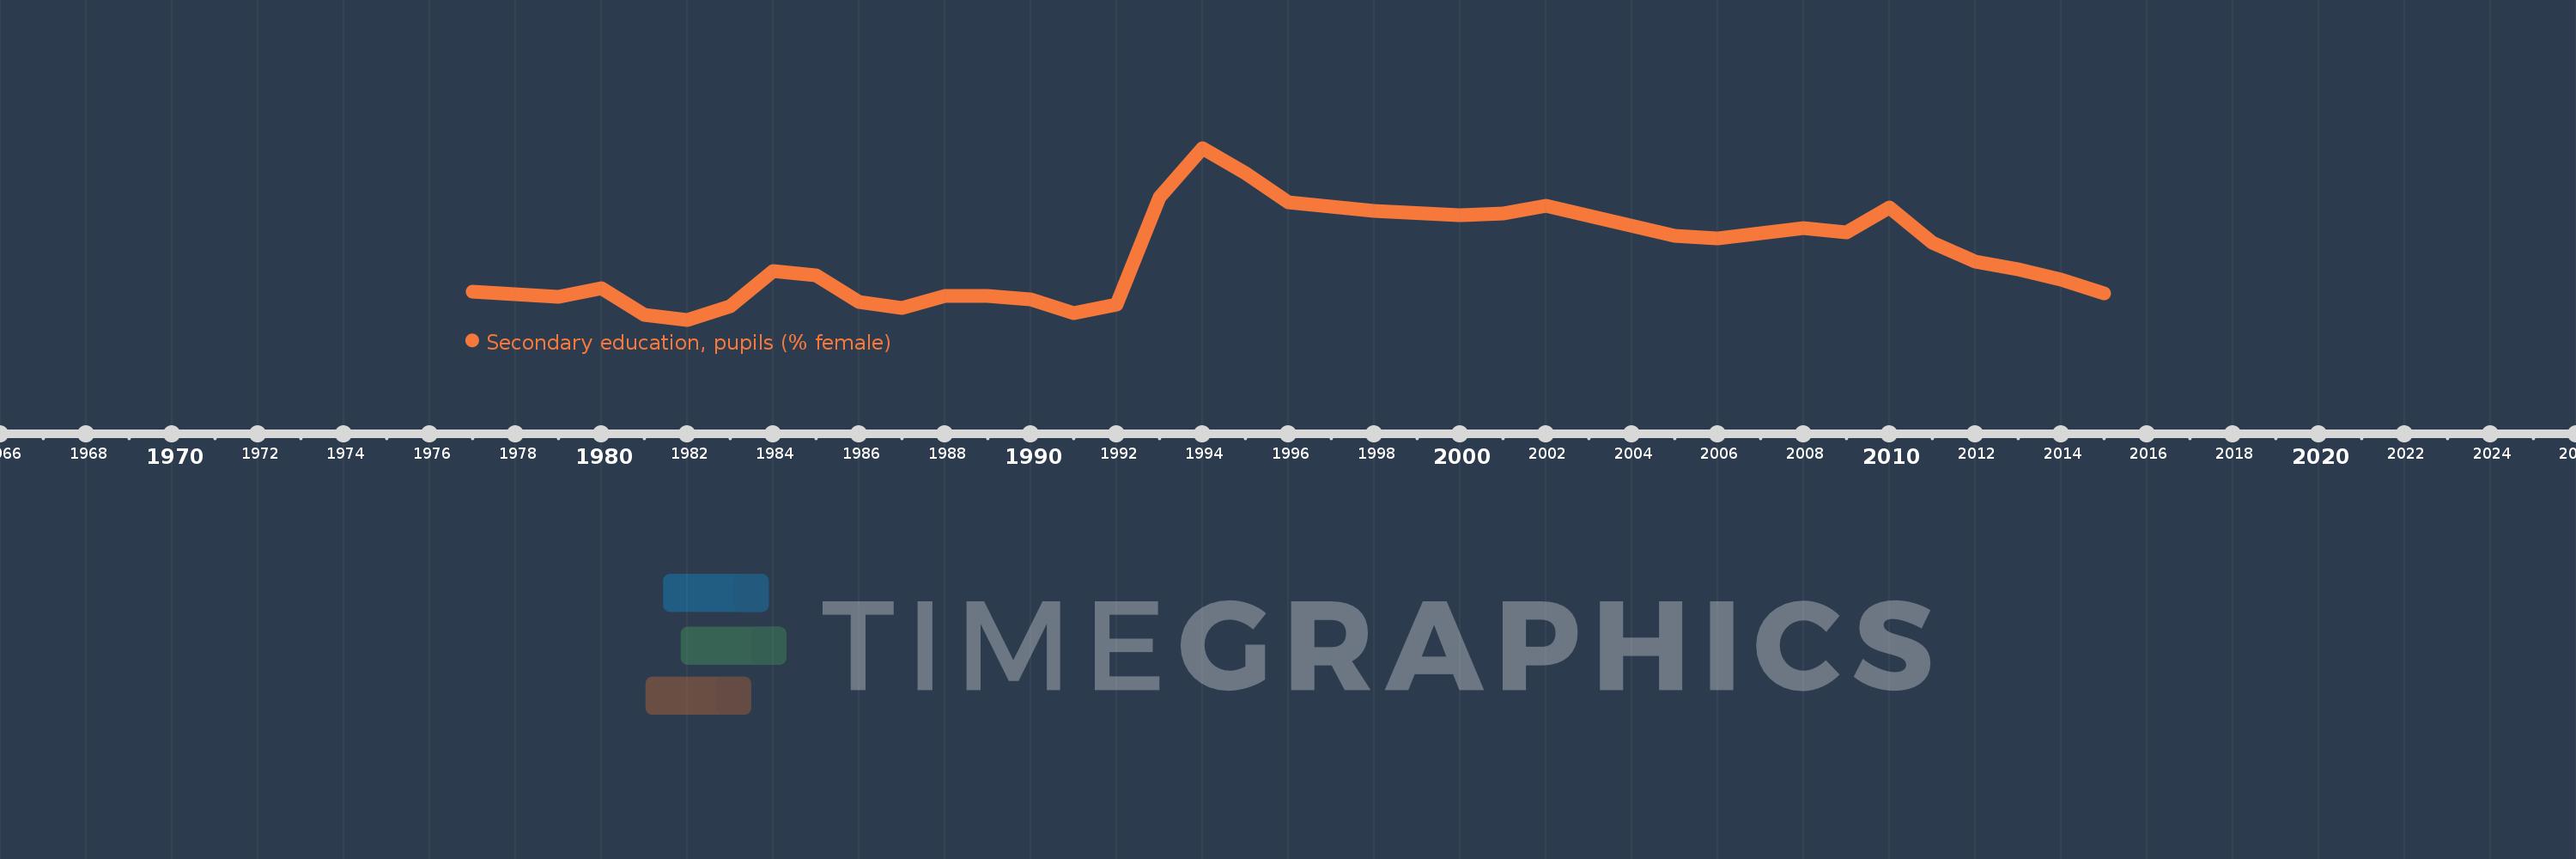
Secondary education, pupils (% female)
2015,2014,2013,2012,2011,2010,2009,2008,2007,2006,2005,2002,2001,2000,1998,1997,1996,1995,1994,1993,1992,1991,1990,1989,1988,1987,1986,1985,1984,1983,1982,1981,1980,1979,1977
This statistics in other country:
AfghanistanAlbaniaAlgeriaAndorraAngolaAntigua and BarbudaArab WorldArgentinaArmeniaArubaAustraliaAustriaAzerbaijanBahamas, TheBahrainBangladeshBarbadosBelarusBelgiumBelizeBeninBermudaBhutanBoliviaBosnia and HerzegovinaBotswanaBrazilBritish Virgin IslandsBrunei DarussalamBulgariaBurkina FasoBurundiCabo VerdeCambodiaCameroonCanadaCaribbean small statesCayman IslandsCentral African RepublicCentral Europe and the BalticsChadChileChinaColombiaComorosCongo, Dem. Rep.Congo, Rep.Costa RicaCote d'IvoireCroatiaCubaCuracaoCyprusCzech RepublicDenmarkDjiboutiDominicaDominican RepublicEarly-demographic dividendEast Asia & PacificEast Asia & Pacific (excluding high income)East Asia & Pacific (IDA & IBRD countries)EcuadorEgypt, Arab Rep.El SalvadorEquatorial GuineaEritreaEstoniaEthiopiaEuro areaEurope & Central AsiaEurope & Central Asia (excluding high income)Europe & Central Asia (IDA & IBRD countries)European UnionFijiFinlandFragile and conflict affected situationsFranceGabonGambia, TheGeorgiaGermanyGhanaGibraltarGreeceGrenadaGuatemalaGuineaGuinea-BissauGuyanaHeavily indebted poor countries (HIPC)High incomeHondurasHong Kong SAR, ChinaHungaryIBRD onlyIcelandIDA & IBRD totalIDA blendIDA onlyIDA totalIndiaIndonesiaIran, Islamic Rep.IraqIrelandIsraelItalyJamaicaJapanJordanKazakhstanKenyaKiribatiKorea, Dem. People’s Rep.Korea, Rep.KuwaitKyrgyz RepublicLao PDRLate-demographic dividendLatin America & Caribbean Latin America & Caribbean (excluding high income)Latin America & the Caribbean (IDA & IBRD countries)LatviaLeast developed countries: UN classificationLebanonLesothoLiberiaLibyaLiechtensteinLithuaniaLow & middle incomeLow incomeLower middle incomeLuxembourgMacao SAR, ChinaMacedonia, FYRMadagascarMalawiMalaysiaMaldivesMaliMaltaMarshall IslandsMauritaniaMauritiusMexicoMicronesia, Fed. Sts.Middle East & North AfricaMiddle East & North Africa (excluding high income)Middle East & North Africa (IDA & IBRD countries)Middle incomeMoldovaMonacoMongoliaMontenegroMoroccoMozambiqueMyanmarNamibiaNauruNepalNetherlandsNew ZealandNicaraguaNigerNigeriaNorth AmericaNorwayOECD membersOmanOther small statesPacific island small statesPakistanPalauPanamaPapua New GuineaParaguayPeruPhilippinesPolandPortugalPost-demographic dividendPre-demographic dividendPuerto RicoQatarRomaniaRussian FederationRwandaSamoaSan MarinoSao Tome and PrincipeSaudi ArabiaSenegalSerbiaSeychellesSierra LeoneSingaporeSint Maarten (Dutch part)Slovak RepublicSloveniaSmall statesSolomon IslandsSomaliaSouth AfricaSouth AsiaSouth Asia (IDA & IBRD)SpainSri LankaSt. Kitts and NevisSt. LuciaSt. Vincent and the GrenadinesSub-Saharan Africa Sub-Saharan Africa (excluding high income)Sub-Saharan Africa (IDA & IBRD countries)SudanSurinameSwazilandSwedenSwitzerlandSyrian Arab RepublicTajikistanTanzaniaThailandTimor-LesteTogoTongaTrinidad and TobagoTunisiaTurkeyTurkmenistanTurks and Caicos IslandsTuvaluUgandaUkraineUnited Arab EmiratesUnited KingdomUnited StatesUpper middle incomeUruguayUzbekistanVanuatuVenezuela, RBVietnamWest Bank and GazaWorldYemen, Rep.ZambiaZimbabwe Timeline:
This timeline shows a graph from 1977 to 2015 of Albania. No data until 1976. Number of actual observations by date: 35.
Source name:
World Development Indicators
Source organization:
United Nations Educational, Scientific, and Cultural Organization (UNESCO) Institute for Statistics.
Categories, topics:
Education, Gender
Last updated:
apr 23, 2017
Indicators value changes by year
Minimum:
45.966
jan 1, 1982
Maximum:
50.016
jan 1, 1994
At the date of observation
Value
Absolute change
Change from previous value
jan 1, 1977
46.627
+46.627
0.0%
jan 1, 1979
46.505
-0.122
-0.26%
jan 1, 1980
46.705
+0.2
0.43%
jan 1, 1981
46.082
-0.623
-1.33%
jan 1, 1982
45.966
-0.116
-0.25%
jan 1, 1983
46.293
+0.327
0.71%
jan 1, 1984
47.115
+0.823
1.78%
jan 1, 1985
47.012
-0.103
-0.22%
jan 1, 1986
46.377
-0.635
-1.35%
jan 1, 1987
46.252
-0.125
-0.27%
jan 1, 1988
46.537
+0.285
0.62%
jan 1, 1989
46.536
-0.001
0.0%
jan 1, 1990
46.448
-0.088
-0.19%
jan 1, 1991
46.119
-0.329
-0.71%
jan 1, 1992
46.334
+0.215
0.47%
jan 1, 1993
48.849
+2.515
5.43%
jan 1, 1994
50.016
+1.167
2.39%
jan 1, 1995
49.415
-0.601
-1.2%
jan 1, 1996
48.733
-0.682
-1.38%
jan 1, 1997
48.638
-0.095
-0.2%
jan 1, 1998
48.526
-0.111
-0.23%
jan 1, 2000
48.43
-0.096
-0.2%
jan 1, 2001
48.477
+0.047
0.1%
jan 1, 2002
48.653
+0.176
0.36%
jan 1, 2005
47.94
-0.713
-1.47%
jan 1, 2006
47.888
-0.052
-0.11%
jan 1, 2007
48.002
+0.114
0.24%
jan 1, 2008
48.133
+0.131
0.27%
jan 1, 2009
48.027
-0.107
-0.22%
jan 1, 2010
48.606
+0.579
1.21%
jan 1, 2011
47.792
-0.814
-1.67%
jan 1, 2012
47.347
-0.445
-0.93%
jan 1, 2013
47.164
-0.184
-0.39%
jan 1, 2014
46.917
-0.247
-0.52%
jan 1, 2015
46.595
-0.322
-0.69%
Ranking of countries by current statistics by years


Comments: