29
/
en
AIzaSyAYiBZKx7MnpbEhh9jyipgxe19OcubqV5w
April 1, 2024
33050
Europe & Central Asia (IDA & IBRD countries)
TEC
false
2
1
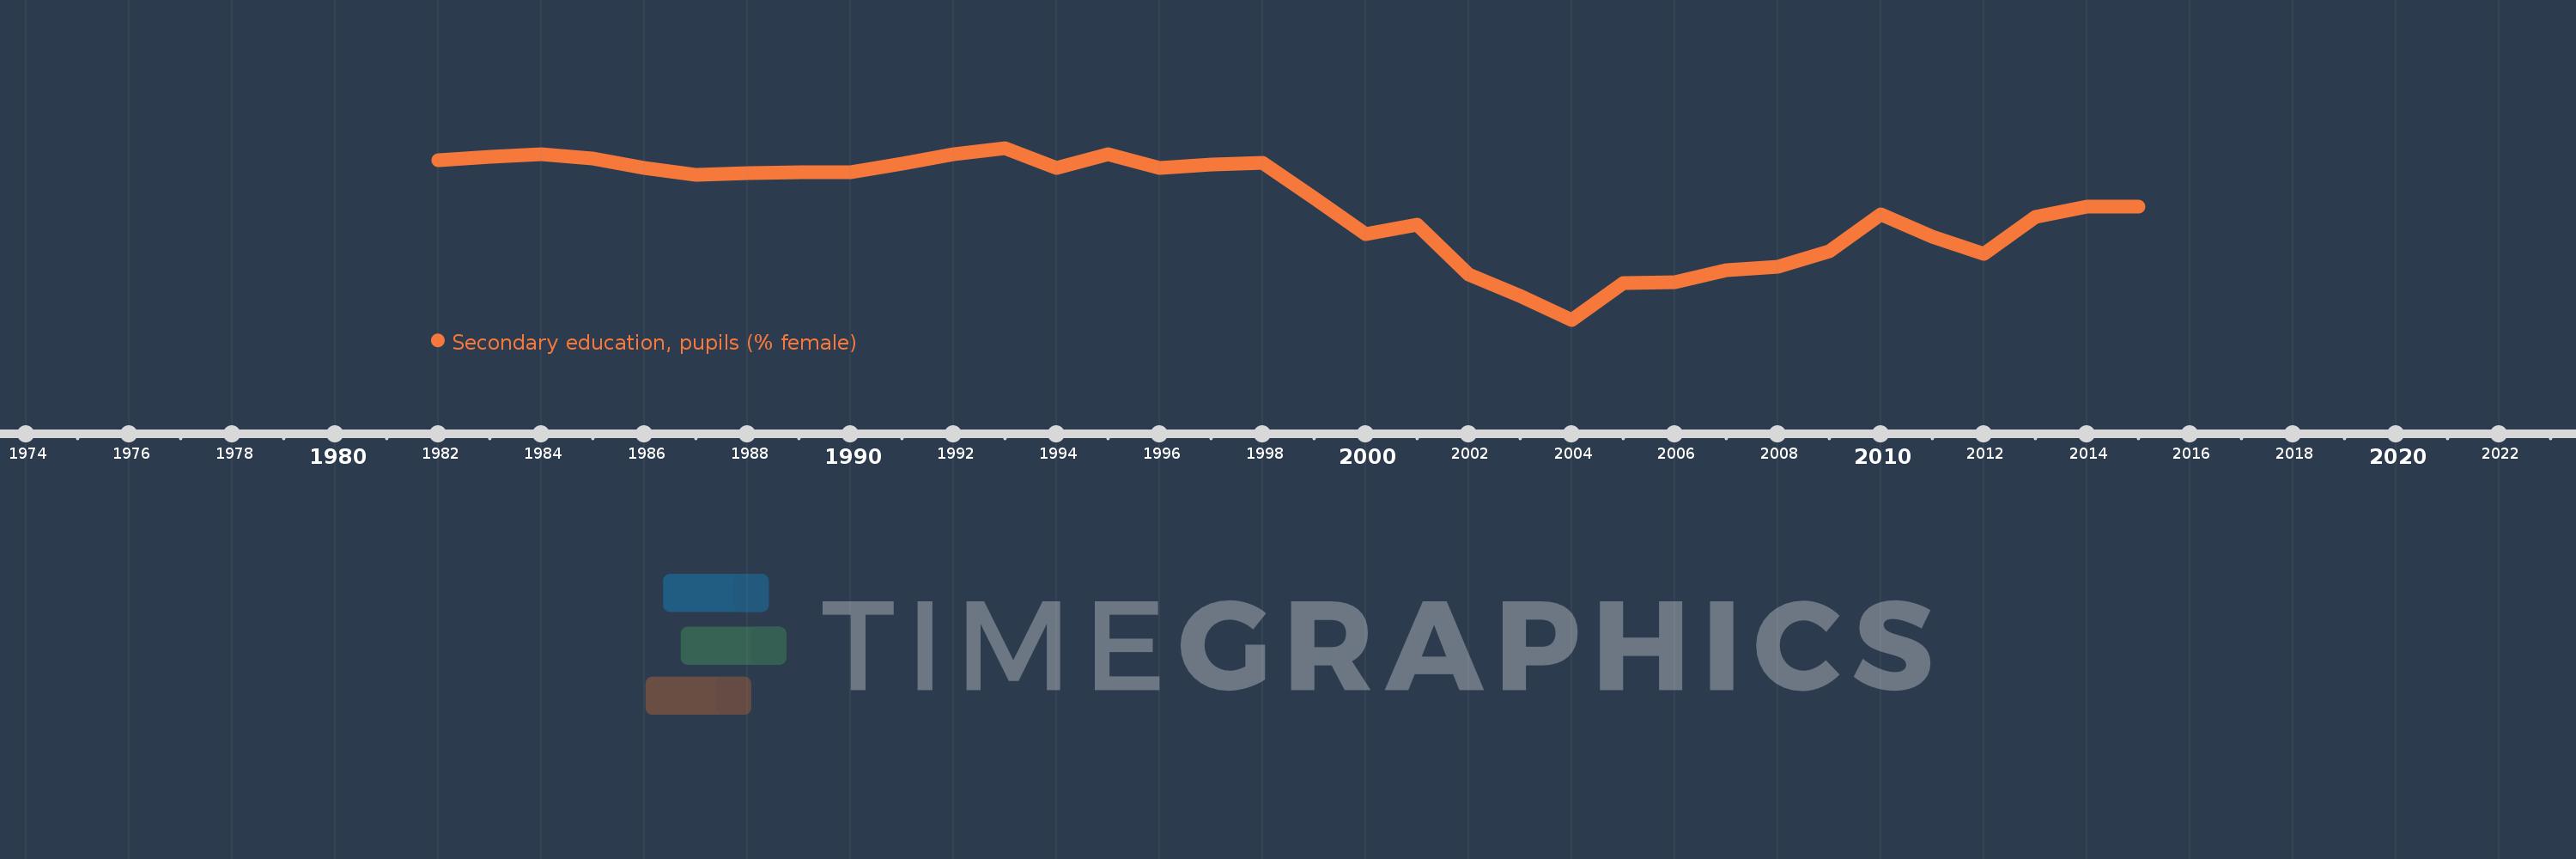
Secondary education, pupils (% female)
2015,2014,2013,2012,2011,2010,2009,2008,2007,2006,2005,2004,2003,2002,2001,2000,1999,1998,1997,1996,1995,1994,1993,1992,1991,1990,1989,1988,1987,1986,1985,1984,1983,1982
This statistics in other country:
AfghanistanAlbaniaAlgeriaAndorraAngolaAntigua and BarbudaArab WorldArgentinaArmeniaArubaAustraliaAustriaAzerbaijanBahamas, TheBahrainBangladeshBarbadosBelarusBelgiumBelizeBeninBermudaBhutanBoliviaBosnia and HerzegovinaBotswanaBrazilBritish Virgin IslandsBrunei DarussalamBulgariaBurkina FasoBurundiCabo VerdeCambodiaCameroonCanadaCaribbean small statesCayman IslandsCentral African RepublicCentral Europe and the BalticsChadChileChinaColombiaComorosCongo, Dem. Rep.Congo, Rep.Costa RicaCote d'IvoireCroatiaCubaCuracaoCyprusCzech RepublicDenmarkDjiboutiDominicaDominican RepublicEarly-demographic dividendEast Asia & PacificEast Asia & Pacific (excluding high income)East Asia & Pacific (IDA & IBRD countries)EcuadorEgypt, Arab Rep.El SalvadorEquatorial GuineaEritreaEstoniaEthiopiaEuro areaEurope & Central AsiaEurope & Central Asia (excluding high income)Europe & Central Asia (IDA & IBRD countries)European UnionFijiFinlandFragile and conflict affected situationsFranceGabonGambia, TheGeorgiaGermanyGhanaGibraltarGreeceGrenadaGuatemalaGuineaGuinea-BissauGuyanaHeavily indebted poor countries (HIPC)High incomeHondurasHong Kong SAR, ChinaHungaryIBRD onlyIcelandIDA & IBRD totalIDA blendIDA onlyIDA totalIndiaIndonesiaIran, Islamic Rep.IraqIrelandIsraelItalyJamaicaJapanJordanKazakhstanKenyaKiribatiKorea, Dem. People’s Rep.Korea, Rep.KuwaitKyrgyz RepublicLao PDRLate-demographic dividendLatin America & Caribbean Latin America & Caribbean (excluding high income)Latin America & the Caribbean (IDA & IBRD countries)LatviaLeast developed countries: UN classificationLebanonLesothoLiberiaLibyaLiechtensteinLithuaniaLow & middle incomeLow incomeLower middle incomeLuxembourgMacao SAR, ChinaMacedonia, FYRMadagascarMalawiMalaysiaMaldivesMaliMaltaMarshall IslandsMauritaniaMauritiusMexicoMicronesia, Fed. Sts.Middle East & North AfricaMiddle East & North Africa (excluding high income)Middle East & North Africa (IDA & IBRD countries)Middle incomeMoldovaMonacoMongoliaMontenegroMoroccoMozambiqueMyanmarNamibiaNauruNepalNetherlandsNew ZealandNicaraguaNigerNigeriaNorth AmericaNorwayOECD membersOmanOther small statesPacific island small statesPakistanPalauPanamaPapua New GuineaParaguayPeruPhilippinesPolandPortugalPost-demographic dividendPre-demographic dividendPuerto RicoQatarRomaniaRussian FederationRwandaSamoaSan MarinoSao Tome and PrincipeSaudi ArabiaSenegalSerbiaSeychellesSierra LeoneSingaporeSint Maarten (Dutch part)Slovak RepublicSloveniaSmall statesSolomon IslandsSomaliaSouth AfricaSouth AsiaSouth Asia (IDA & IBRD)SpainSri LankaSt. Kitts and NevisSt. LuciaSt. Vincent and the GrenadinesSub-Saharan Africa Sub-Saharan Africa (excluding high income)Sub-Saharan Africa (IDA & IBRD countries)SudanSurinameSwazilandSwedenSwitzerlandSyrian Arab RepublicTajikistanTanzaniaThailandTimor-LesteTogoTongaTrinidad and TobagoTunisiaTurkeyTurkmenistanTurks and Caicos IslandsTuvaluUgandaUkraineUnited Arab EmiratesUnited KingdomUnited StatesUpper middle incomeUruguayUzbekistanVanuatuVenezuela, RBVietnamWest Bank and GazaWorldYemen, Rep.ZambiaZimbabwe Timeline:
This timeline shows a graph from 1982 to 2015 of Europe & Central Asia (IDA & IBRD countries). No data until 1981. Number of actual observations by date: 34.
Source name:
World Development Indicators
Source organization:
United Nations Educational, Scientific, and Cultural Organization (UNESCO) Institute for Statistics.
Categories, topics:
Education, Gender
Last updated:
apr 23, 2017
Indicators value changes by year
Maximum:
48.567
jan 1, 1993
At the date of observation
Value
Absolute change
Change from previous value
jan 1, 1982
48.504
+48.504
0.0%
jan 1, 1983
48.522
+0.018
0.04%
jan 1, 1984
48.535
+0.013
0.03%
jan 1, 1985
48.512
-0.023
-0.05%
jan 1, 1986
48.465
-0.047
-0.1%
jan 1, 1987
48.428
-0.037
-0.08%
jan 1, 1988
48.44
+0.012
0.02%
jan 1, 1989
48.445
+0.004
0.01%
jan 1, 1990
48.442
-0.002
-0.01%
jan 1, 1991
48.486
+0.044
0.09%
jan 1, 1992
48.533
+0.047
0.1%
jan 1, 1993
48.567
+0.034
0.07%
jan 1, 1994
48.465
-0.102
-0.21%
jan 1, 1995
48.536
+0.071
0.15%
jan 1, 1996
48.467
-0.069
-0.14%
jan 1, 1997
48.481
+0.014
0.03%
jan 1, 1998
48.492
+0.01
0.02%
jan 1, 1999
48.31
-0.182
-0.38%
jan 1, 2000
48.126
-0.184
-0.38%
jan 1, 2001
48.176
+0.051
0.11%
jan 1, 2002
47.92
-0.257
-0.53%
jan 1, 2003
47.811
-0.109
-0.23%
jan 1, 2004
47.69
-0.121
-0.25%
jan 1, 2005
47.876
+0.186
0.39%
jan 1, 2006
47.883
+0.007
0.01%
jan 1, 2007
47.942
+0.06
0.12%
jan 1, 2008
47.959
+0.017
0.04%
jan 1, 2009
48.039
+0.08
0.17%
jan 1, 2010
48.227
+0.188
0.39%
jan 1, 2011
48.114
-0.113
-0.23%
jan 1, 2012
48.027
-0.087
-0.18%
jan 1, 2013
48.215
+0.188
0.39%
jan 1, 2014
48.267
+0.052
0.11%
jan 1, 2015
48.268
+0.001
0.0%
Ranking of countries by current statistics by years


Comments: