29
/
en
AIzaSyAYiBZKx7MnpbEhh9jyipgxe19OcubqV5w
April 1, 2024
54427
Pacific island small states
PSS
false
2
1
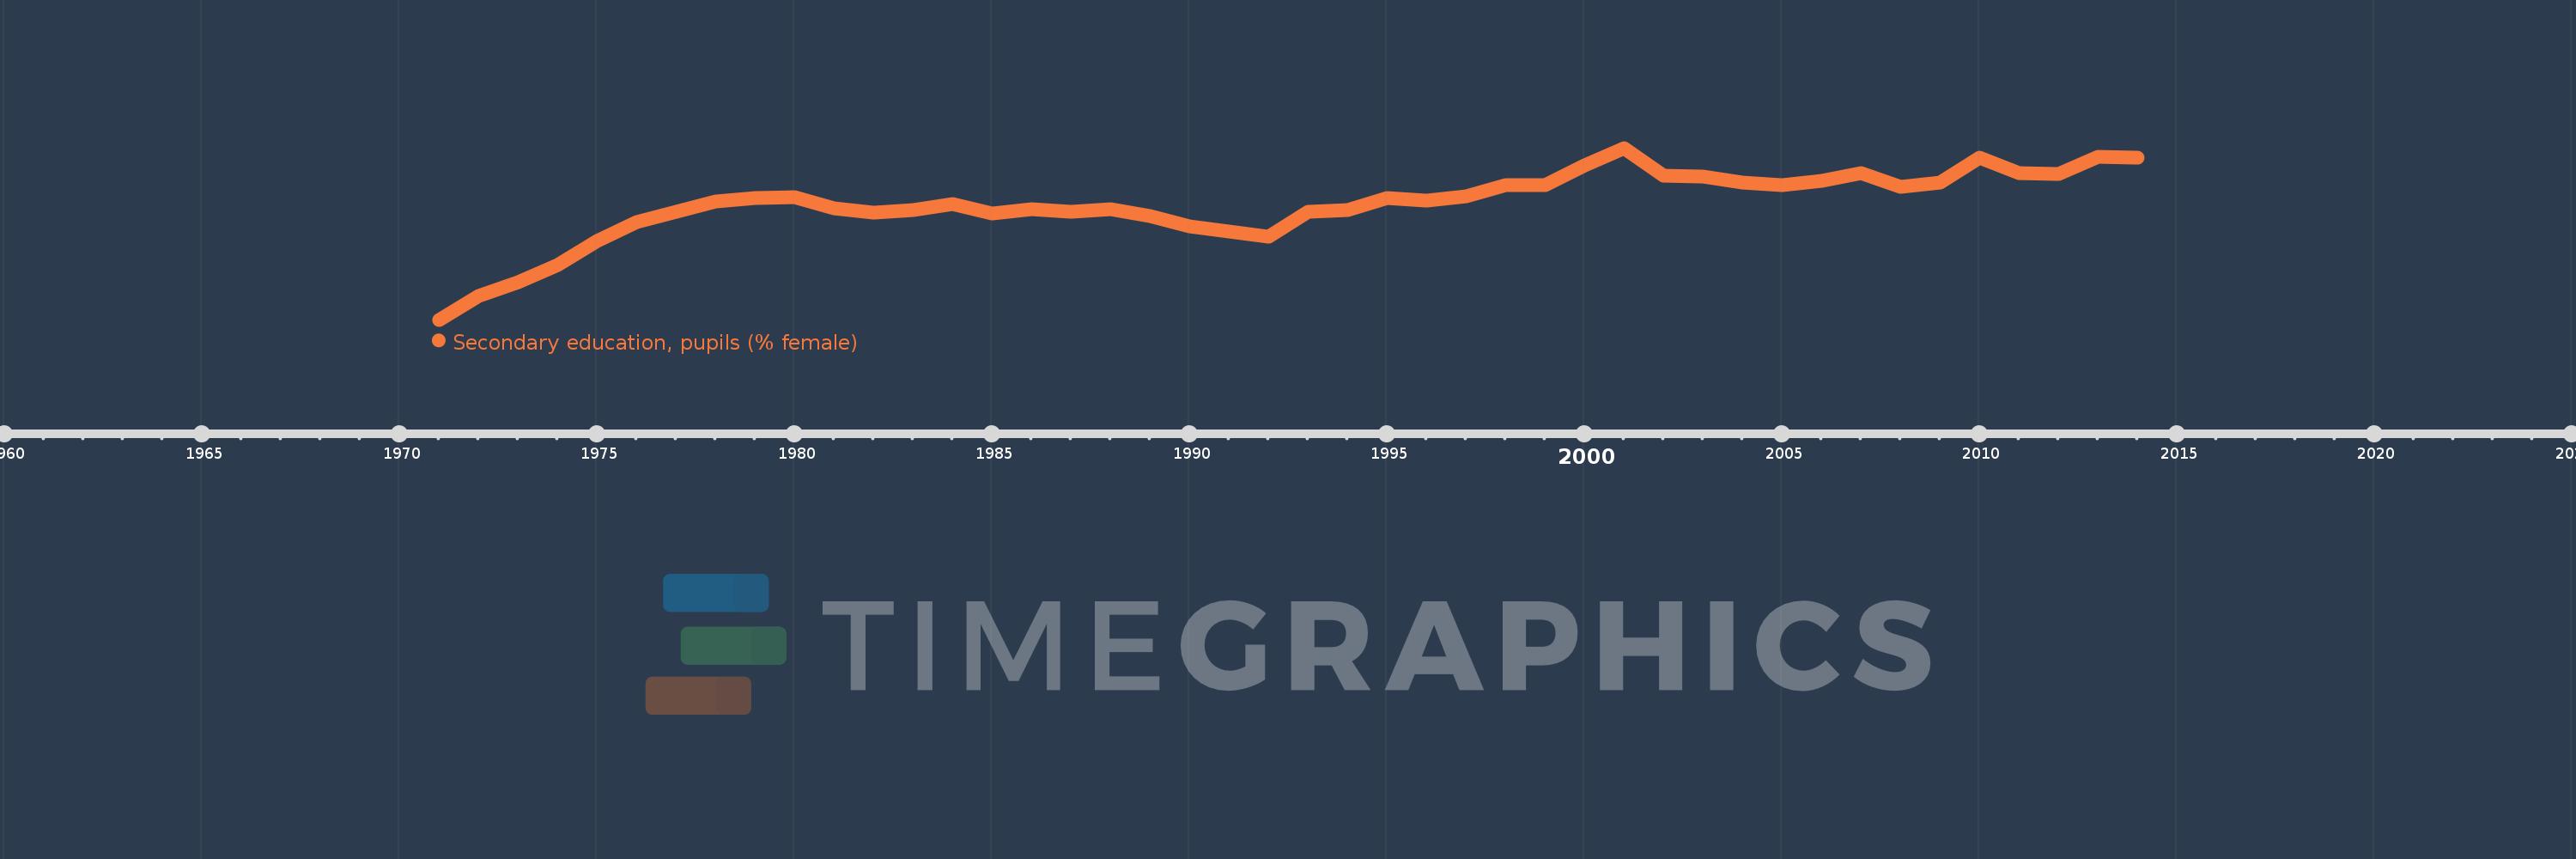
Secondary education, pupils (% female)
2014,2013,2012,2011,2010,2009,2008,2007,2006,2005,2004,2003,2002,2001,2000,1999,1998,1997,1996,1995,1994,1993,1992,1991,1990,1989,1988,1987,1986,1985,1984,1983,1982,1981,1980,1979,1978,1977,1976,1975,1974,1973,1972,1971
This statistics in other country:
AfghanistanAlbaniaAlgeriaAndorraAngolaAntigua and BarbudaArab WorldArgentinaArmeniaArubaAustraliaAustriaAzerbaijanBahamas, TheBahrainBangladeshBarbadosBelarusBelgiumBelizeBeninBermudaBhutanBoliviaBosnia and HerzegovinaBotswanaBrazilBritish Virgin IslandsBrunei DarussalamBulgariaBurkina FasoBurundiCabo VerdeCambodiaCameroonCanadaCaribbean small statesCayman IslandsCentral African RepublicCentral Europe and the BalticsChadChileChinaColombiaComorosCongo, Dem. Rep.Congo, Rep.Costa RicaCote d'IvoireCroatiaCubaCuracaoCyprusCzech RepublicDenmarkDjiboutiDominicaDominican RepublicEarly-demographic dividendEast Asia & PacificEast Asia & Pacific (excluding high income)East Asia & Pacific (IDA & IBRD countries)EcuadorEgypt, Arab Rep.El SalvadorEquatorial GuineaEritreaEstoniaEthiopiaEuro areaEurope & Central AsiaEurope & Central Asia (excluding high income)Europe & Central Asia (IDA & IBRD countries)European UnionFijiFinlandFragile and conflict affected situationsFranceGabonGambia, TheGeorgiaGermanyGhanaGibraltarGreeceGrenadaGuatemalaGuineaGuinea-BissauGuyanaHeavily indebted poor countries (HIPC)High incomeHondurasHong Kong SAR, ChinaHungaryIBRD onlyIcelandIDA & IBRD totalIDA blendIDA onlyIDA totalIndiaIndonesiaIran, Islamic Rep.IraqIrelandIsraelItalyJamaicaJapanJordanKazakhstanKenyaKiribatiKorea, Dem. People’s Rep.Korea, Rep.KuwaitKyrgyz RepublicLao PDRLate-demographic dividendLatin America & Caribbean Latin America & Caribbean (excluding high income)Latin America & the Caribbean (IDA & IBRD countries)LatviaLeast developed countries: UN classificationLebanonLesothoLiberiaLibyaLiechtensteinLithuaniaLow & middle incomeLow incomeLower middle incomeLuxembourgMacao SAR, ChinaMacedonia, FYRMadagascarMalawiMalaysiaMaldivesMaliMaltaMarshall IslandsMauritaniaMauritiusMexicoMicronesia, Fed. Sts.Middle East & North AfricaMiddle East & North Africa (excluding high income)Middle East & North Africa (IDA & IBRD countries)Middle incomeMoldovaMonacoMongoliaMontenegroMoroccoMozambiqueMyanmarNamibiaNauruNepalNetherlandsNew ZealandNicaraguaNigerNigeriaNorth AmericaNorwayOECD membersOmanOther small statesPacific island small statesPakistanPalauPanamaPapua New GuineaParaguayPeruPhilippinesPolandPortugalPost-demographic dividendPre-demographic dividendPuerto RicoQatarRomaniaRussian FederationRwandaSamoaSan MarinoSao Tome and PrincipeSaudi ArabiaSenegalSerbiaSeychellesSierra LeoneSingaporeSint Maarten (Dutch part)Slovak RepublicSloveniaSmall statesSolomon IslandsSomaliaSouth AfricaSouth AsiaSouth Asia (IDA & IBRD)SpainSri LankaSt. Kitts and NevisSt. LuciaSt. Vincent and the GrenadinesSub-Saharan Africa Sub-Saharan Africa (excluding high income)Sub-Saharan Africa (IDA & IBRD countries)SudanSurinameSwazilandSwedenSwitzerlandSyrian Arab RepublicTajikistanTanzaniaThailandTimor-LesteTogoTongaTrinidad and TobagoTunisiaTurkeyTurkmenistanTurks and Caicos IslandsTuvaluUgandaUkraineUnited Arab EmiratesUnited KingdomUnited StatesUpper middle incomeUruguayUzbekistanVanuatuVenezuela, RBVietnamWest Bank and GazaWorldYemen, Rep.ZambiaZimbabwe Timeline:
This timeline shows a graph from 1971 to 2014 of Pacific island small states. No data until 1970. Number of actual observations by date: 44.
Source name:
World Development Indicators
Source organization:
United Nations Educational, Scientific, and Cultural Organization (UNESCO) Institute for Statistics.
Categories, topics:
Education, Gender
Last updated:
apr 23, 2017
Indicators value changes by year
Minimum:
45.951
jan 1, 1971
Maximum:
49.937
jan 1, 2001
At the date of observation
Value
Absolute change
Change from previous value
jan 1, 1971
45.951
+45.951
0.0%
jan 1, 1972
46.506
+0.554
1.21%
jan 1, 1973
46.823
+0.317
0.68%
jan 1, 1974
47.223
+0.4
0.85%
jan 1, 1975
47.775
+0.553
1.17%
jan 1, 1976
48.218
+0.443
0.93%
jan 1, 1977
48.451
+0.232
0.48%
jan 1, 1978
48.69
+0.239
0.49%
jan 1, 1979
48.774
+0.084
0.17%
jan 1, 1980
48.79
+0.016
0.03%
jan 1, 1981
48.527
-0.263
-0.54%
jan 1, 1982
48.437
-0.09
-0.18%
jan 1, 1983
48.502
+0.065
0.13%
jan 1, 1984
48.631
+0.129
0.27%
jan 1, 1985
48.418
-0.213
-0.44%
jan 1, 1986
48.519
+0.101
0.21%
jan 1, 1987
48.465
-0.054
-0.11%
jan 1, 1988
48.523
+0.057
0.12%
jan 1, 1989
48.355
-0.167
-0.34%
jan 1, 1990
48.11
-0.245
-0.51%
jan 1, 1991
47.993
-0.117
-0.24%
jan 1, 1992
47.875
-0.118
-0.25%
jan 1, 1993
48.464
+0.589
1.23%
jan 1, 1994
48.504
+0.04
0.08%
jan 1, 1995
48.767
+0.262
0.54%
jan 1, 1996
48.711
-0.056
-0.12%
jan 1, 1997
48.823
+0.112
0.23%
jan 1, 1998
49.071
+0.248
0.51%
jan 1, 1999
49.07
-0.001
0.0%
jan 1, 2000
49.526
+0.456
0.93%
jan 1, 2001
49.937
+0.41
0.83%
jan 1, 2002
49.302
-0.634
-1.27%
jan 1, 2003
49.274
-0.028
-0.06%
jan 1, 2004
49.134
-0.14
-0.28%
jan 1, 2005
49.081
-0.052
-0.11%
jan 1, 2006
49.181
+0.1
0.2%
jan 1, 2007
49.359
+0.178
0.36%
jan 1, 2008
49.036
-0.323
-0.65%
jan 1, 2009
49.138
+0.102
0.21%
jan 1, 2010
49.721
+0.583
1.19%
jan 1, 2011
49.345
-0.376
-0.76%
jan 1, 2012
49.337
-0.008
-0.02%
jan 1, 2013
49.722
+0.385
0.78%
jan 1, 2014
49.719
-0.003
-0.01%
Ranking of countries by current statistics by years


Comments: