29
/
en
AIzaSyAYiBZKx7MnpbEhh9jyipgxe19OcubqV5w
April 1, 2024
208428
Netherlands
NLD
true
2
1
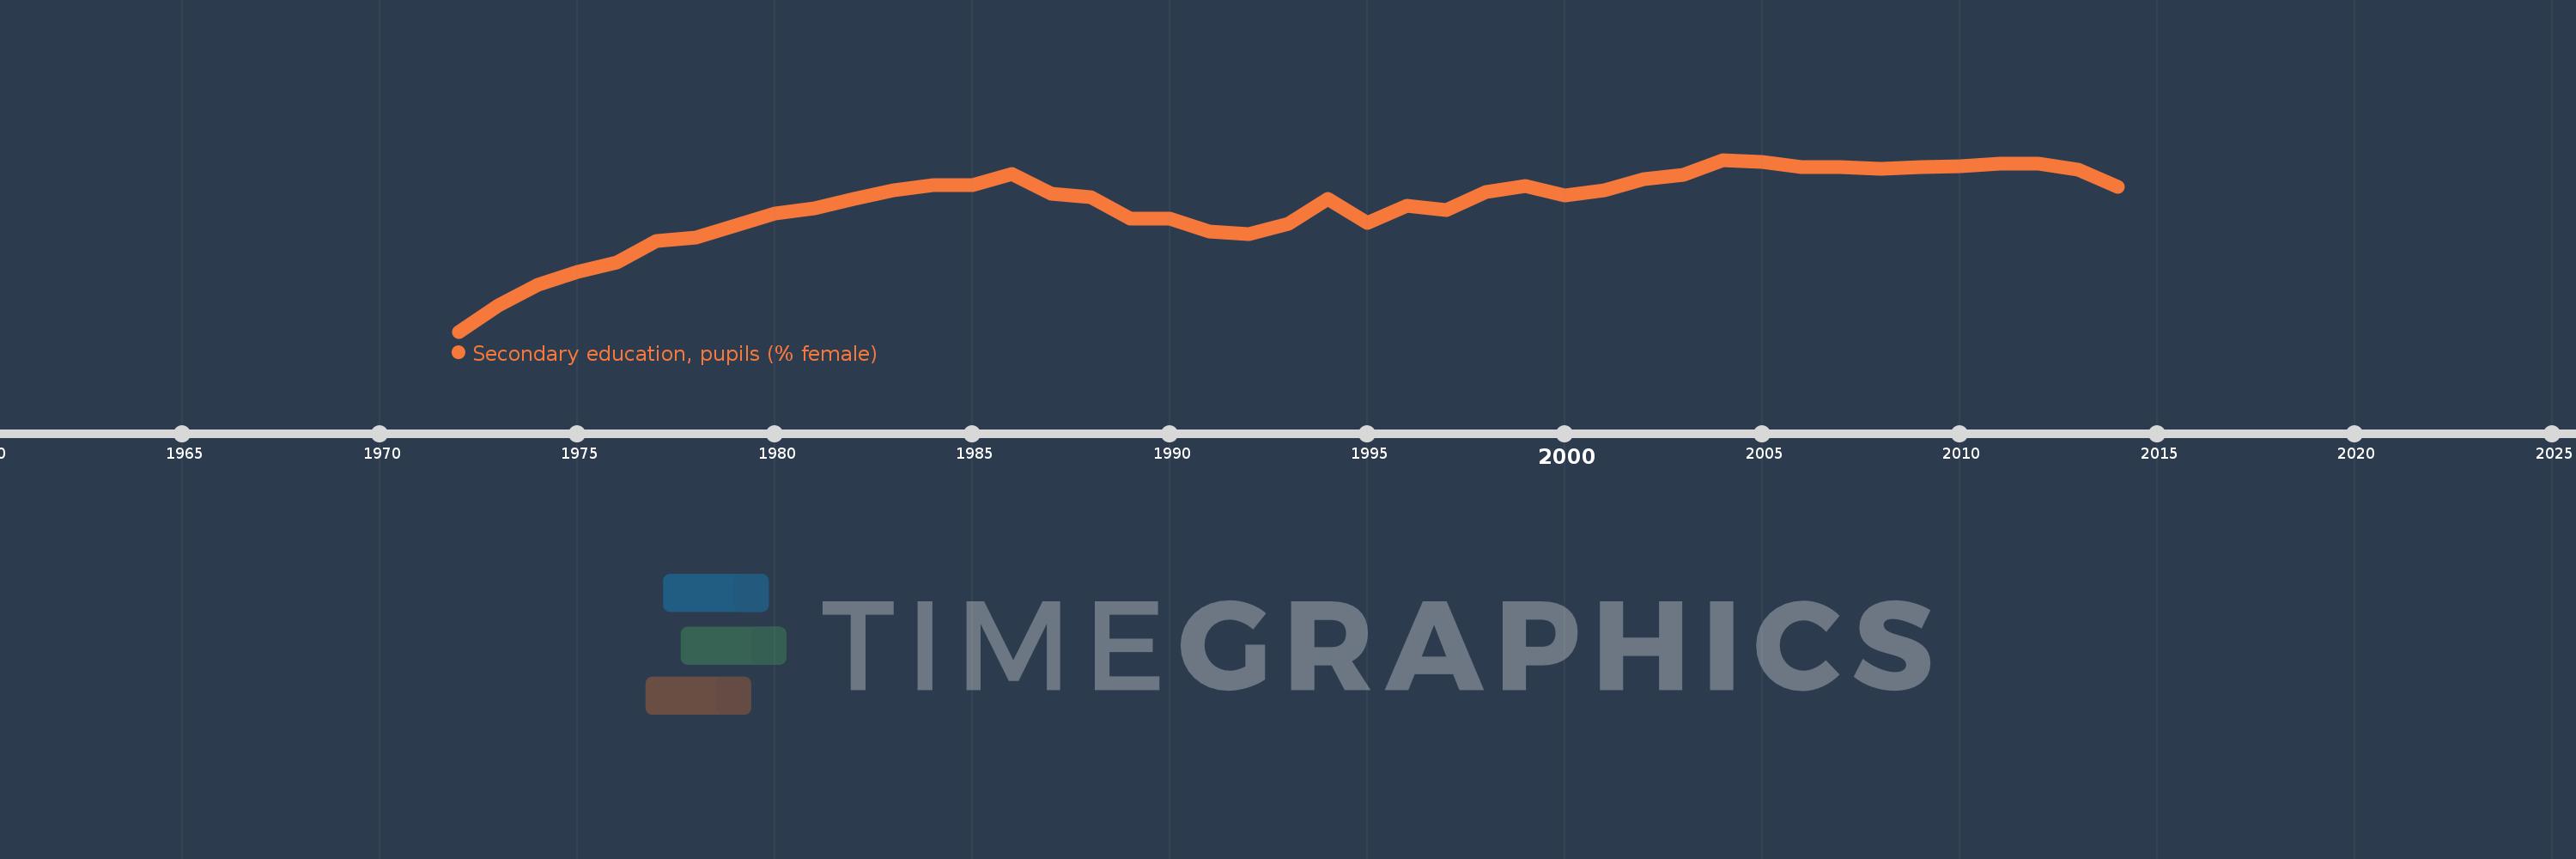
Secondary education, pupils (% female)
2014,2013,2012,2011,2010,2009,2008,2007,2006,2005,2004,2003,2002,2001,2000,1999,1998,1997,1996,1995,1994,1993,1992,1991,1990,1989,1988,1987,1986,1985,1984,1983,1982,1981,1980,1979,1978,1977,1976,1975,1974,1973,1972
This statistics in other country:
AfghanistanAlbaniaAlgeriaAndorraAngolaAntigua and BarbudaArab WorldArgentinaArmeniaArubaAustraliaAustriaAzerbaijanBahamas, TheBahrainBangladeshBarbadosBelarusBelgiumBelizeBeninBermudaBhutanBoliviaBosnia and HerzegovinaBotswanaBrazilBritish Virgin IslandsBrunei DarussalamBulgariaBurkina FasoBurundiCabo VerdeCambodiaCameroonCanadaCaribbean small statesCayman IslandsCentral African RepublicCentral Europe and the BalticsChadChileChinaColombiaComorosCongo, Dem. Rep.Congo, Rep.Costa RicaCote d'IvoireCroatiaCubaCuracaoCyprusCzech RepublicDenmarkDjiboutiDominicaDominican RepublicEarly-demographic dividendEast Asia & PacificEast Asia & Pacific (excluding high income)East Asia & Pacific (IDA & IBRD countries)EcuadorEgypt, Arab Rep.El SalvadorEquatorial GuineaEritreaEstoniaEthiopiaEuro areaEurope & Central AsiaEurope & Central Asia (excluding high income)Europe & Central Asia (IDA & IBRD countries)European UnionFijiFinlandFragile and conflict affected situationsFranceGabonGambia, TheGeorgiaGermanyGhanaGibraltarGreeceGrenadaGuatemalaGuineaGuinea-BissauGuyanaHeavily indebted poor countries (HIPC)High incomeHondurasHong Kong SAR, ChinaHungaryIBRD onlyIcelandIDA & IBRD totalIDA blendIDA onlyIDA totalIndiaIndonesiaIran, Islamic Rep.IraqIrelandIsraelItalyJamaicaJapanJordanKazakhstanKenyaKiribatiKorea, Dem. People’s Rep.Korea, Rep.KuwaitKyrgyz RepublicLao PDRLate-demographic dividendLatin America & Caribbean Latin America & Caribbean (excluding high income)Latin America & the Caribbean (IDA & IBRD countries)LatviaLeast developed countries: UN classificationLebanonLesothoLiberiaLibyaLiechtensteinLithuaniaLow & middle incomeLow incomeLower middle incomeLuxembourgMacao SAR, ChinaMacedonia, FYRMadagascarMalawiMalaysiaMaldivesMaliMaltaMarshall IslandsMauritaniaMauritiusMexicoMicronesia, Fed. Sts.Middle East & North AfricaMiddle East & North Africa (excluding high income)Middle East & North Africa (IDA & IBRD countries)Middle incomeMoldovaMonacoMongoliaMontenegroMoroccoMozambiqueMyanmarNamibiaNauruNepalNetherlandsNew ZealandNicaraguaNigerNigeriaNorth AmericaNorwayOECD membersOmanOther small statesPacific island small statesPakistanPalauPanamaPapua New GuineaParaguayPeruPhilippinesPolandPortugalPost-demographic dividendPre-demographic dividendPuerto RicoQatarRomaniaRussian FederationRwandaSamoaSan MarinoSao Tome and PrincipeSaudi ArabiaSenegalSerbiaSeychellesSierra LeoneSingaporeSint Maarten (Dutch part)Slovak RepublicSloveniaSmall statesSolomon IslandsSomaliaSouth AfricaSouth AsiaSouth Asia (IDA & IBRD)SpainSri LankaSt. Kitts and NevisSt. LuciaSt. Vincent and the GrenadinesSub-Saharan Africa Sub-Saharan Africa (excluding high income)Sub-Saharan Africa (IDA & IBRD countries)SudanSurinameSwazilandSwedenSwitzerlandSyrian Arab RepublicTajikistanTanzaniaThailandTimor-LesteTogoTongaTrinidad and TobagoTunisiaTurkeyTurkmenistanTurks and Caicos IslandsTuvaluUgandaUkraineUnited Arab EmiratesUnited KingdomUnited StatesUpper middle incomeUruguayUzbekistanVanuatuVenezuela, RBVietnamWest Bank and GazaWorldYemen, Rep.ZambiaZimbabwe Timeline:
This timeline shows a graph from 1972 to 2014 of Netherlands. No data until 1971. Number of actual observations by date: 43.
Source name:
World Development Indicators
Source organization:
United Nations Educational, Scientific, and Cultural Organization (UNESCO) Institute for Statistics.
Categories, topics:
Education, Gender
Last updated:
apr 23, 2017
Indicators value changes by year
Minimum:
44.791
jan 1, 1972
At the date of observation
Value
Absolute change
Change from previous value
jan 1, 1972
44.791
+44.791
0.0%
jan 1, 1973
45.364
+0.573
1.28%
jan 1, 1974
45.82
+0.456
1.01%
jan 1, 1975
46.099
+0.279
0.61%
jan 1, 1976
46.296
+0.197
0.43%
jan 1, 1977
46.769
+0.473
1.02%
jan 1, 1978
46.845
+0.076
0.16%
jan 1, 1979
47.105
+0.26
0.56%
jan 1, 1980
47.368
+0.262
0.56%
jan 1, 1981
47.494
+0.126
0.27%
jan 1, 1982
47.697
+0.203
0.43%
jan 1, 1983
47.887
+0.19
0.4%
jan 1, 1984
48.002
+0.115
0.24%
jan 1, 1985
47.989
-0.013
-0.03%
jan 1, 1986
48.239
+0.25
0.52%
jan 1, 1987
47.804
-0.435
-0.9%
jan 1, 1988
47.734
-0.069
-0.14%
jan 1, 1989
47.27
-0.464
-0.97%
jan 1, 1990
47.266
-0.004
-0.01%
jan 1, 1991
46.978
-0.287
-0.61%
jan 1, 1992
46.933
-0.045
-0.1%
jan 1, 1993
47.15
+0.217
0.46%
jan 1, 1994
47.696
+0.546
1.16%
jan 1, 1995
47.169
-0.527
-1.1%
jan 1, 1996
47.549
+0.38
0.81%
jan 1, 1997
47.458
-0.091
-0.19%
jan 1, 1998
47.843
+0.384
0.81%
jan 1, 1999
47.976
+0.133
0.28%
jan 1, 2000
47.776
-0.2
-0.42%
jan 1, 2001
47.875
+0.1
0.21%
jan 1, 2002
48.127
+0.252
0.53%
jan 1, 2003
48.23
+0.103
0.21%
jan 1, 2004
48.55
+0.32
0.66%
jan 1, 2005
48.498
-0.052
-0.11%
jan 1, 2006
48.382
-0.116
-0.24%
jan 1, 2007
48.392
+0.01
0.02%
jan 1, 2008
48.358
-0.034
-0.07%
jan 1, 2009
48.384
+0.026
0.05%
jan 1, 2010
48.408
+0.024
0.05%
jan 1, 2011
48.457
+0.049
0.1%
jan 1, 2012
48.466
+0.009
0.02%
jan 1, 2013
48.332
-0.133
-0.27%
jan 1, 2014
47.951
-0.382
-0.79%
Ranking of countries by current statistics by years


Comments: