29
/
en
AIzaSyAYiBZKx7MnpbEhh9jyipgxe19OcubqV5w
April 1, 2024
55883
Pre-demographic dividend
PRE
false
2
1
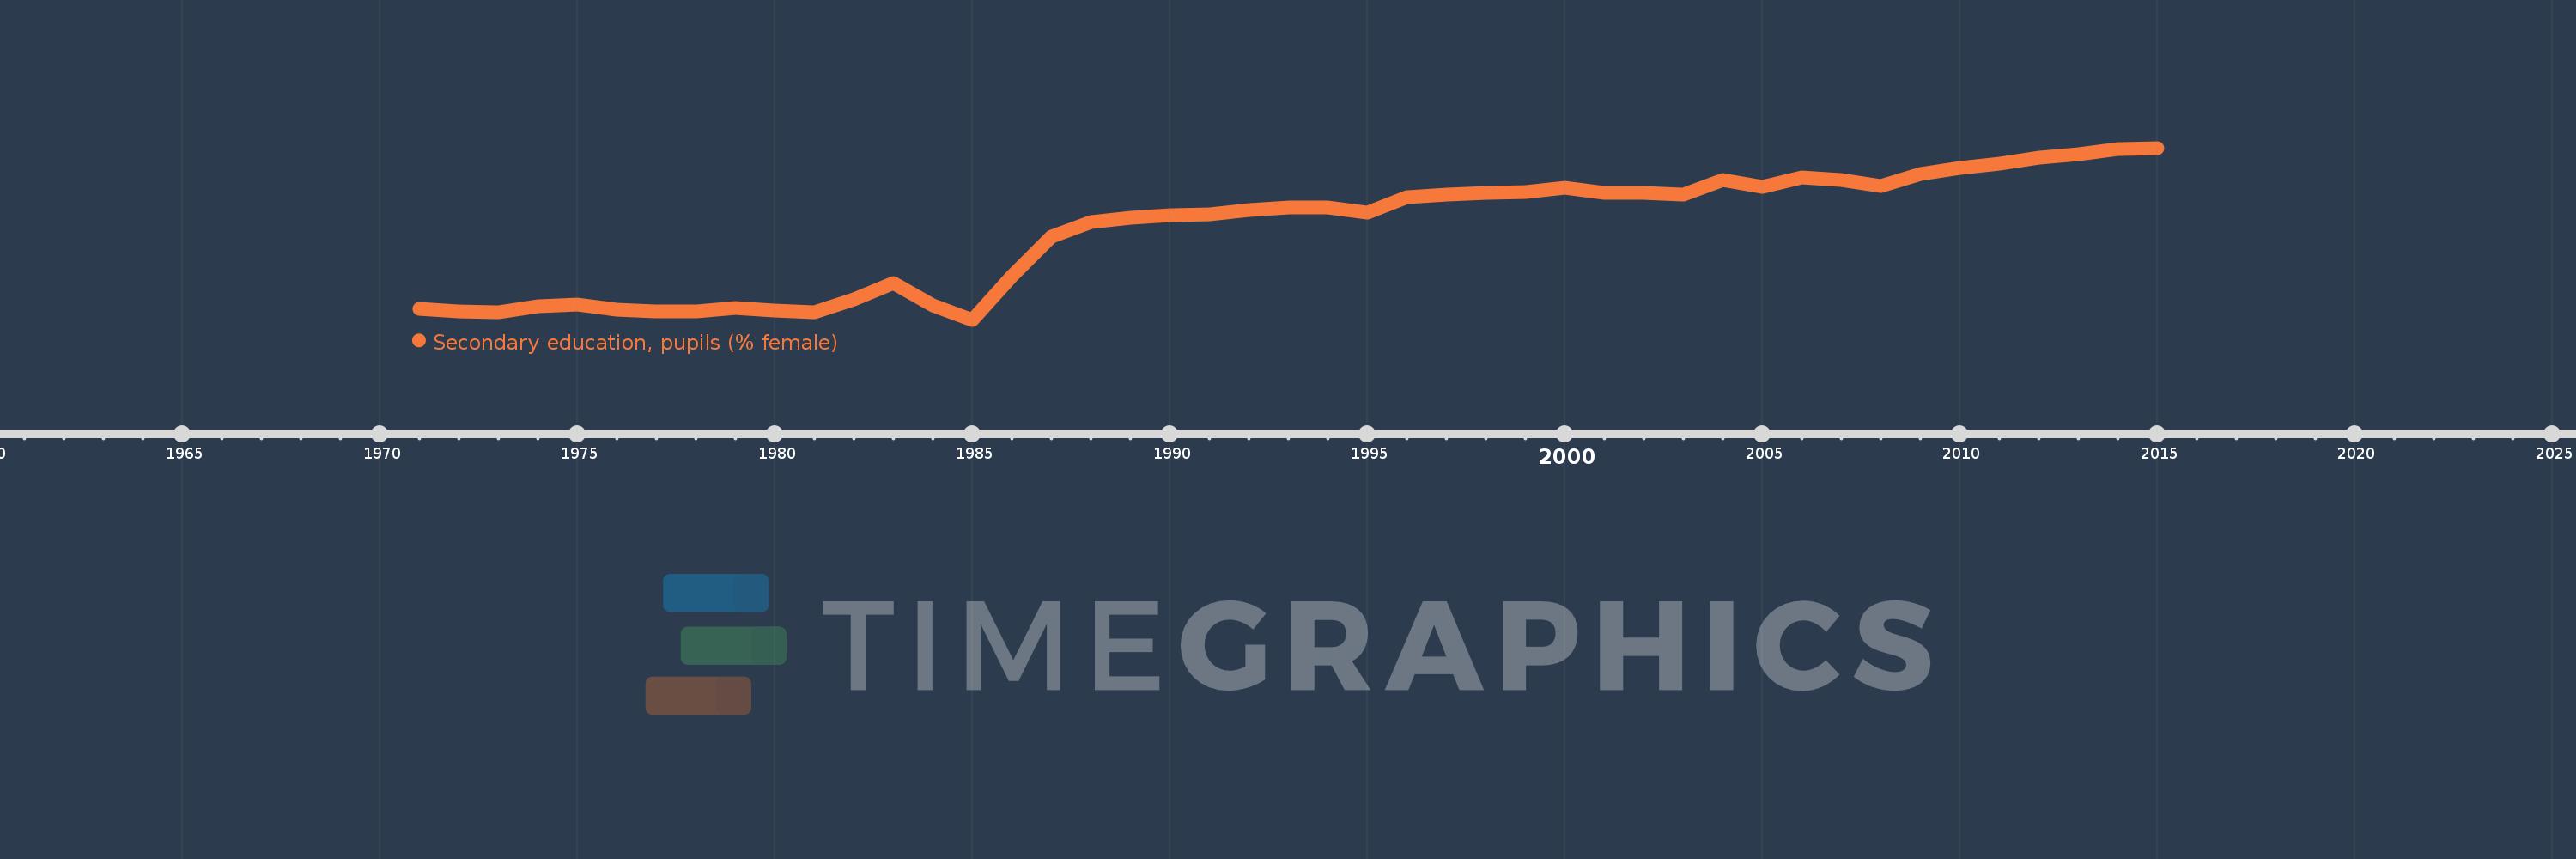
Secondary education, pupils (% female)
2015,2014,2013,2012,2011,2010,2009,2008,2007,2006,2005,2004,2003,2002,2001,2000,1999,1998,1997,1996,1995,1994,1993,1992,1991,1990,1989,1988,1987,1986,1985,1984,1983,1982,1981,1980,1979,1978,1977,1976,1975,1974,1973,1972,1971
This statistics in other country:
AfghanistanAlbaniaAlgeriaAndorraAngolaAntigua and BarbudaArab WorldArgentinaArmeniaArubaAustraliaAustriaAzerbaijanBahamas, TheBahrainBangladeshBarbadosBelarusBelgiumBelizeBeninBermudaBhutanBoliviaBosnia and HerzegovinaBotswanaBrazilBritish Virgin IslandsBrunei DarussalamBulgariaBurkina FasoBurundiCabo VerdeCambodiaCameroonCanadaCaribbean small statesCayman IslandsCentral African RepublicCentral Europe and the BalticsChadChileChinaColombiaComorosCongo, Dem. Rep.Congo, Rep.Costa RicaCote d'IvoireCroatiaCubaCuracaoCyprusCzech RepublicDenmarkDjiboutiDominicaDominican RepublicEarly-demographic dividendEast Asia & PacificEast Asia & Pacific (excluding high income)East Asia & Pacific (IDA & IBRD countries)EcuadorEgypt, Arab Rep.El SalvadorEquatorial GuineaEritreaEstoniaEthiopiaEuro areaEurope & Central AsiaEurope & Central Asia (excluding high income)Europe & Central Asia (IDA & IBRD countries)European UnionFijiFinlandFragile and conflict affected situationsFranceGabonGambia, TheGeorgiaGermanyGhanaGibraltarGreeceGrenadaGuatemalaGuineaGuinea-BissauGuyanaHeavily indebted poor countries (HIPC)High incomeHondurasHong Kong SAR, ChinaHungaryIBRD onlyIcelandIDA & IBRD totalIDA blendIDA onlyIDA totalIndiaIndonesiaIran, Islamic Rep.IraqIrelandIsraelItalyJamaicaJapanJordanKazakhstanKenyaKiribatiKorea, Dem. People’s Rep.Korea, Rep.KuwaitKyrgyz RepublicLao PDRLate-demographic dividendLatin America & Caribbean Latin America & Caribbean (excluding high income)Latin America & the Caribbean (IDA & IBRD countries)LatviaLeast developed countries: UN classificationLebanonLesothoLiberiaLibyaLiechtensteinLithuaniaLow & middle incomeLow incomeLower middle incomeLuxembourgMacao SAR, ChinaMacedonia, FYRMadagascarMalawiMalaysiaMaldivesMaliMaltaMarshall IslandsMauritaniaMauritiusMexicoMicronesia, Fed. Sts.Middle East & North AfricaMiddle East & North Africa (excluding high income)Middle East & North Africa (IDA & IBRD countries)Middle incomeMoldovaMonacoMongoliaMontenegroMoroccoMozambiqueMyanmarNamibiaNauruNepalNetherlandsNew ZealandNicaraguaNigerNigeriaNorth AmericaNorwayOECD membersOmanOther small statesPacific island small statesPakistanPalauPanamaPapua New GuineaParaguayPeruPhilippinesPolandPortugalPost-demographic dividendPre-demographic dividendPuerto RicoQatarRomaniaRussian FederationRwandaSamoaSan MarinoSao Tome and PrincipeSaudi ArabiaSenegalSerbiaSeychellesSierra LeoneSingaporeSint Maarten (Dutch part)Slovak RepublicSloveniaSmall statesSolomon IslandsSomaliaSouth AfricaSouth AsiaSouth Asia (IDA & IBRD)SpainSri LankaSt. Kitts and NevisSt. LuciaSt. Vincent and the GrenadinesSub-Saharan Africa Sub-Saharan Africa (excluding high income)Sub-Saharan Africa (IDA & IBRD countries)SudanSurinameSwazilandSwedenSwitzerlandSyrian Arab RepublicTajikistanTanzaniaThailandTimor-LesteTogoTongaTrinidad and TobagoTunisiaTurkeyTurkmenistanTurks and Caicos IslandsTuvaluUgandaUkraineUnited Arab EmiratesUnited KingdomUnited StatesUpper middle incomeUruguayUzbekistanVanuatuVenezuela, RBVietnamWest Bank and GazaWorldYemen, Rep.ZambiaZimbabwe Timeline:
This timeline shows a graph from 1971 to 2015 of Pre-demographic dividend. No data until 1970. Number of actual observations by date: 45.
Source name:
World Development Indicators
Source organization:
United Nations Educational, Scientific, and Cultural Organization (UNESCO) Institute for Statistics.
Categories, topics:
Education, Gender
Last updated:
apr 23, 2017
Indicators value changes by year
Minimum:
33.042
jan 1, 1985
Maximum:
43.785
jan 1, 2015
At the date of observation
Value
Absolute change
Change from previous value
jan 1, 1971
33.702
+33.702
0.0%
jan 1, 1972
33.556
-0.146
-0.43%
jan 1, 1973
33.516
-0.04
-0.12%
jan 1, 1974
33.865
+0.349
1.04%
jan 1, 1975
33.986
+0.121
0.36%
jan 1, 1976
33.644
-0.342
-1.01%
jan 1, 1977
33.55
-0.094
-0.28%
jan 1, 1978
33.548
-0.002
-0.01%
jan 1, 1979
33.771
+0.223
0.67%
jan 1, 1980
33.593
-0.178
-0.53%
jan 1, 1981
33.535
-0.058
-0.17%
jan 1, 1982
34.292
+0.757
2.26%
jan 1, 1983
35.31
+1.018
2.97%
jan 1, 1984
33.92
-1.39
-3.94%
jan 1, 1985
33.042
-0.878
-2.59%
jan 1, 1986
35.772
+2.73
8.26%
jan 1, 1987
38.255
+2.483
6.94%
jan 1, 1988
39.156
+0.901
2.36%
jan 1, 1989
39.437
+0.281
0.72%
jan 1, 1990
39.602
+0.164
0.42%
jan 1, 1991
39.651
+0.05
0.13%
jan 1, 1992
39.892
+0.241
0.61%
jan 1, 1993
40.037
+0.145
0.36%
jan 1, 1994
40.063
+0.026
0.06%
jan 1, 1995
39.74
-0.323
-0.81%
jan 1, 1996
40.729
+0.989
2.49%
jan 1, 1997
40.858
+0.13
0.32%
jan 1, 1998
40.965
+0.107
0.26%
jan 1, 1999
41.021
+0.056
0.14%
jan 1, 2000
41.297
+0.276
0.67%
jan 1, 2001
40.998
-0.299
-0.72%
jan 1, 2002
40.966
-0.032
-0.08%
jan 1, 2003
40.873
-0.092
-0.22%
jan 1, 2004
41.805
+0.931
2.28%
jan 1, 2005
41.375
-0.43
-1.03%
jan 1, 2006
41.938
+0.563
1.36%
jan 1, 2007
41.756
-0.181
-0.43%
jan 1, 2008
41.426
-0.33
-0.79%
jan 1, 2009
42.14
+0.713
1.72%
jan 1, 2010
42.515
+0.376
0.89%
jan 1, 2011
42.828
+0.312
0.73%
jan 1, 2012
43.154
+0.326
0.76%
jan 1, 2013
43.412
+0.258
0.6%
jan 1, 2014
43.735
+0.323
0.74%
jan 1, 2015
43.785
+0.05
0.11%
Ranking of countries by current statistics by years


Comments: