29
/
en
AIzaSyAYiBZKx7MnpbEhh9jyipgxe19OcubqV5w
April 1, 2024
106634
China
CHN
true
2
1
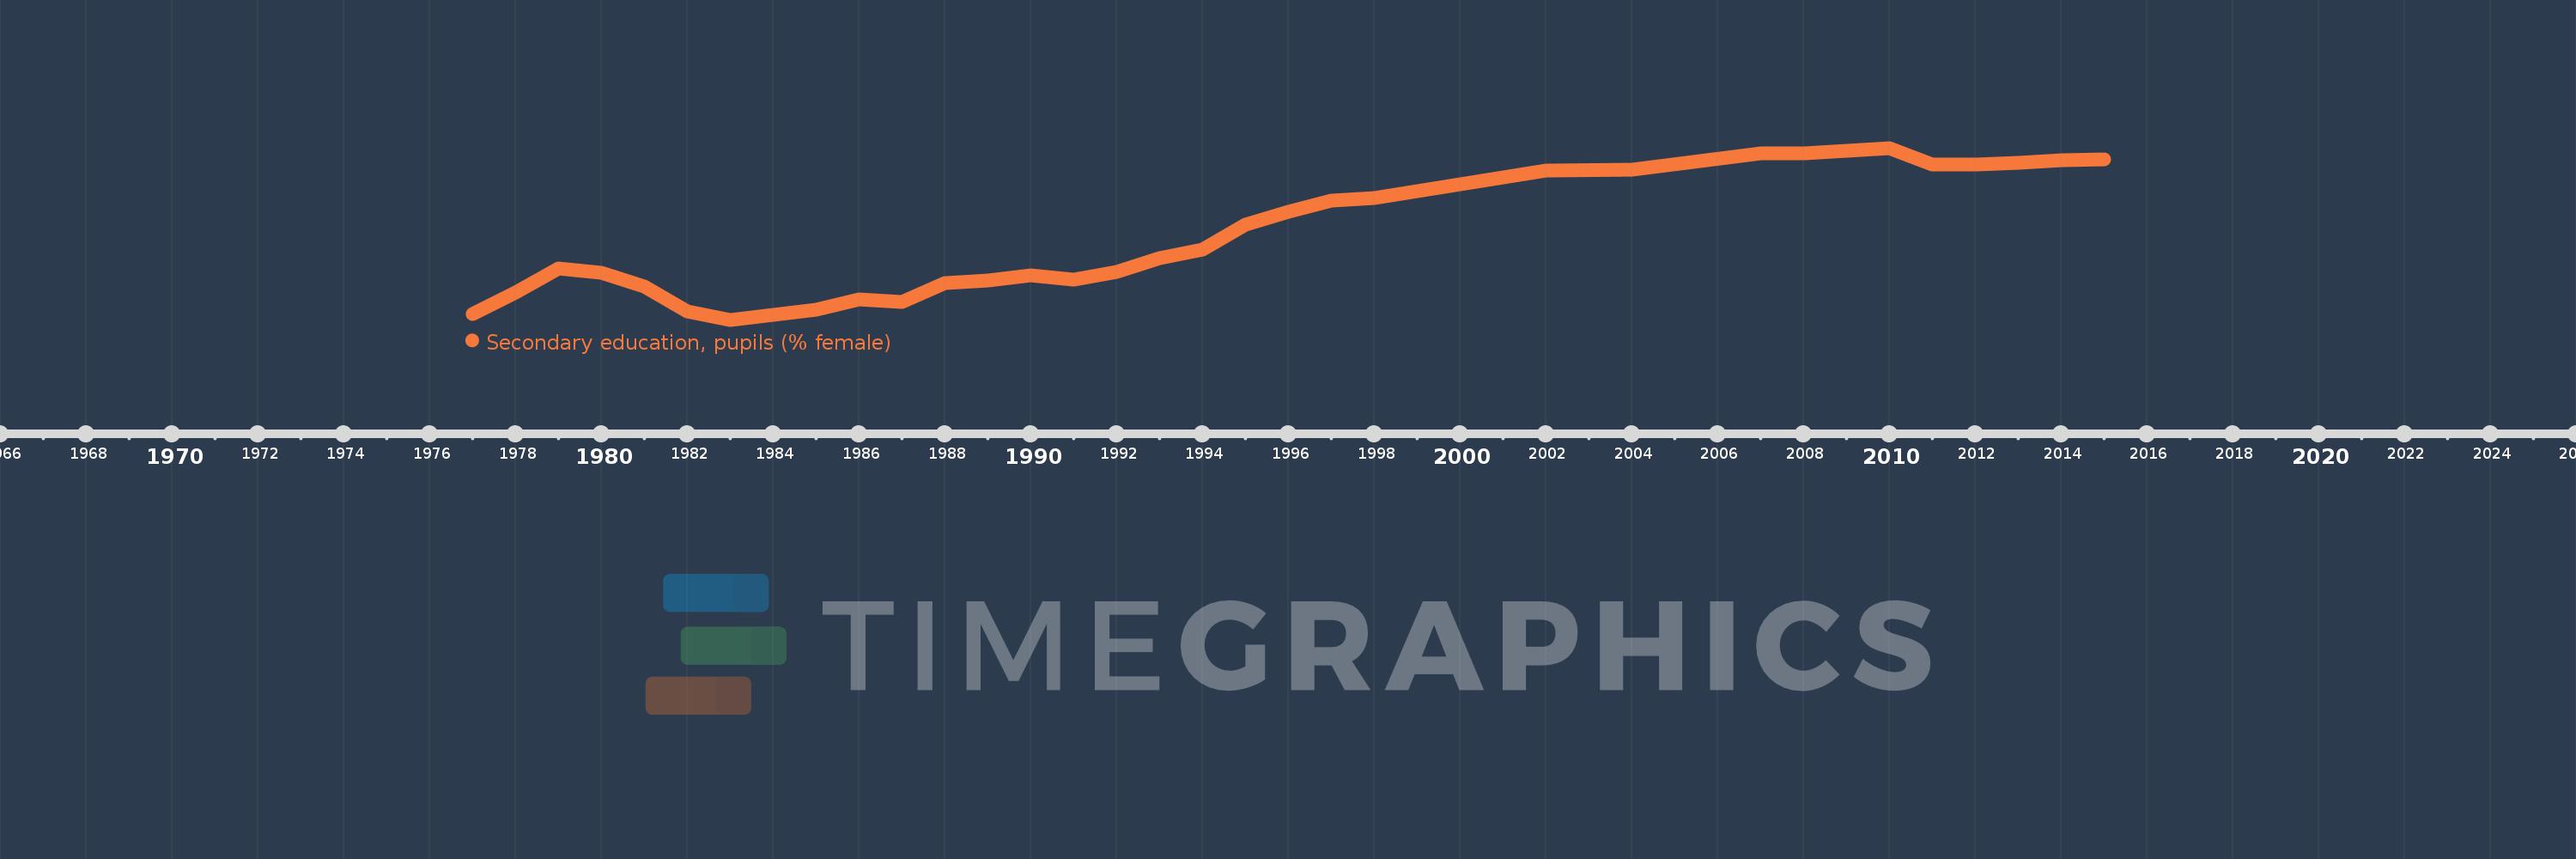
Secondary education, pupils (% female)
2015,2014,2013,2012,2011,2010,2009,2008,2007,2004,2002,1998,1997,1996,1995,1994,1993,1992,1991,1990,1989,1988,1987,1986,1985,1984,1983,1982,1981,1980,1979,1978,1977
This statistics in other country:
AfghanistanAlbaniaAlgeriaAndorraAngolaAntigua and BarbudaArab WorldArgentinaArmeniaArubaAustraliaAustriaAzerbaijanBahamas, TheBahrainBangladeshBarbadosBelarusBelgiumBelizeBeninBermudaBhutanBoliviaBosnia and HerzegovinaBotswanaBrazilBritish Virgin IslandsBrunei DarussalamBulgariaBurkina FasoBurundiCabo VerdeCambodiaCameroonCanadaCaribbean small statesCayman IslandsCentral African RepublicCentral Europe and the BalticsChadChileChinaColombiaComorosCongo, Dem. Rep.Congo, Rep.Costa RicaCote d'IvoireCroatiaCubaCuracaoCyprusCzech RepublicDenmarkDjiboutiDominicaDominican RepublicEarly-demographic dividendEast Asia & PacificEast Asia & Pacific (excluding high income)East Asia & Pacific (IDA & IBRD countries)EcuadorEgypt, Arab Rep.El SalvadorEquatorial GuineaEritreaEstoniaEthiopiaEuro areaEurope & Central AsiaEurope & Central Asia (excluding high income)Europe & Central Asia (IDA & IBRD countries)European UnionFijiFinlandFragile and conflict affected situationsFranceGabonGambia, TheGeorgiaGermanyGhanaGibraltarGreeceGrenadaGuatemalaGuineaGuinea-BissauGuyanaHeavily indebted poor countries (HIPC)High incomeHondurasHong Kong SAR, ChinaHungaryIBRD onlyIcelandIDA & IBRD totalIDA blendIDA onlyIDA totalIndiaIndonesiaIran, Islamic Rep.IraqIrelandIsraelItalyJamaicaJapanJordanKazakhstanKenyaKiribatiKorea, Dem. People’s Rep.Korea, Rep.KuwaitKyrgyz RepublicLao PDRLate-demographic dividendLatin America & Caribbean Latin America & Caribbean (excluding high income)Latin America & the Caribbean (IDA & IBRD countries)LatviaLeast developed countries: UN classificationLebanonLesothoLiberiaLibyaLiechtensteinLithuaniaLow & middle incomeLow incomeLower middle incomeLuxembourgMacao SAR, ChinaMacedonia, FYRMadagascarMalawiMalaysiaMaldivesMaliMaltaMarshall IslandsMauritaniaMauritiusMexicoMicronesia, Fed. Sts.Middle East & North AfricaMiddle East & North Africa (excluding high income)Middle East & North Africa (IDA & IBRD countries)Middle incomeMoldovaMonacoMongoliaMontenegroMoroccoMozambiqueMyanmarNamibiaNauruNepalNetherlandsNew ZealandNicaraguaNigerNigeriaNorth AmericaNorwayOECD membersOmanOther small statesPacific island small statesPakistanPalauPanamaPapua New GuineaParaguayPeruPhilippinesPolandPortugalPost-demographic dividendPre-demographic dividendPuerto RicoQatarRomaniaRussian FederationRwandaSamoaSan MarinoSao Tome and PrincipeSaudi ArabiaSenegalSerbiaSeychellesSierra LeoneSingaporeSint Maarten (Dutch part)Slovak RepublicSloveniaSmall statesSolomon IslandsSomaliaSouth AfricaSouth AsiaSouth Asia (IDA & IBRD)SpainSri LankaSt. Kitts and NevisSt. LuciaSt. Vincent and the GrenadinesSub-Saharan Africa Sub-Saharan Africa (excluding high income)Sub-Saharan Africa (IDA & IBRD countries)SudanSurinameSwazilandSwedenSwitzerlandSyrian Arab RepublicTajikistanTanzaniaThailandTimor-LesteTogoTongaTrinidad and TobagoTunisiaTurkeyTurkmenistanTurks and Caicos IslandsTuvaluUgandaUkraineUnited Arab EmiratesUnited KingdomUnited StatesUpper middle incomeUruguayUzbekistanVanuatuVenezuela, RBVietnamWest Bank and GazaWorldYemen, Rep.ZambiaZimbabwe Timeline:
This timeline shows a graph from 1977 to 2015 of China. No data until 1976. Number of actual observations by date: 33.
Source name:
World Development Indicators
Source organization:
United Nations Educational, Scientific, and Cultural Organization (UNESCO) Institute for Statistics.
Categories, topics:
Education, Gender
Last updated:
apr 23, 2017
Indicators value changes by year
Minimum:
38.889
jan 1, 1983
Maximum:
47.972
jan 1, 2010
At the date of observation
Value
Absolute change
Change from previous value
jan 1, 1977
39.192
+39.192
0.0%
jan 1, 1978
40.328
+1.136
2.9%
jan 1, 1979
41.606
+1.278
3.17%
jan 1, 1980
41.356
-0.249
-0.6%
jan 1, 1981
40.627
-0.73
-1.76%
jan 1, 1982
39.348
-1.279
-3.15%
jan 1, 1983
38.889
-0.459
-1.17%
jan 1, 1984
39.139
+0.251
0.64%
jan 1, 1985
39.429
+0.29
0.74%
jan 1, 1986
39.966
+0.536
1.36%
jan 1, 1987
39.831
-0.135
-0.34%
jan 1, 1988
40.837
+1.006
2.53%
jan 1, 1989
40.97
+0.132
0.32%
jan 1, 1990
41.227
+0.258
0.63%
jan 1, 1991
40.988
-0.239
-0.58%
jan 1, 1992
41.436
+0.448
1.09%
jan 1, 1993
42.162
+0.726
1.75%
jan 1, 1994
42.615
+0.453
1.07%
jan 1, 1995
43.922
+1.306
3.07%
jan 1, 1996
44.583
+0.661
1.5%
jan 1, 1997
45.195
+0.612
1.37%
jan 1, 1998
45.347
+0.152
0.34%
jan 1, 2002
46.756
+1.409
3.11%
jan 1, 2004
46.845
+0.09
0.19%
jan 1, 2007
47.668
+0.822
1.76%
jan 1, 2008
47.695
+0.028
0.06%
jan 1, 2009
47.83
+0.135
0.28%
jan 1, 2010
47.972
+0.142
0.3%
jan 1, 2011
47.097
-0.875
-1.82%
jan 1, 2012
47.115
+0.018
0.04%
jan 1, 2013
47.187
+0.072
0.15%
jan 1, 2014
47.338
+0.151
0.32%
jan 1, 2015
47.352
+0.014
0.03%
Ranking of countries by current statistics by years


Comments: