29
/
en
AIzaSyAYiBZKx7MnpbEhh9jyipgxe19OcubqV5w
April 1, 2024
57653
South Asia
SAS
false
2
1
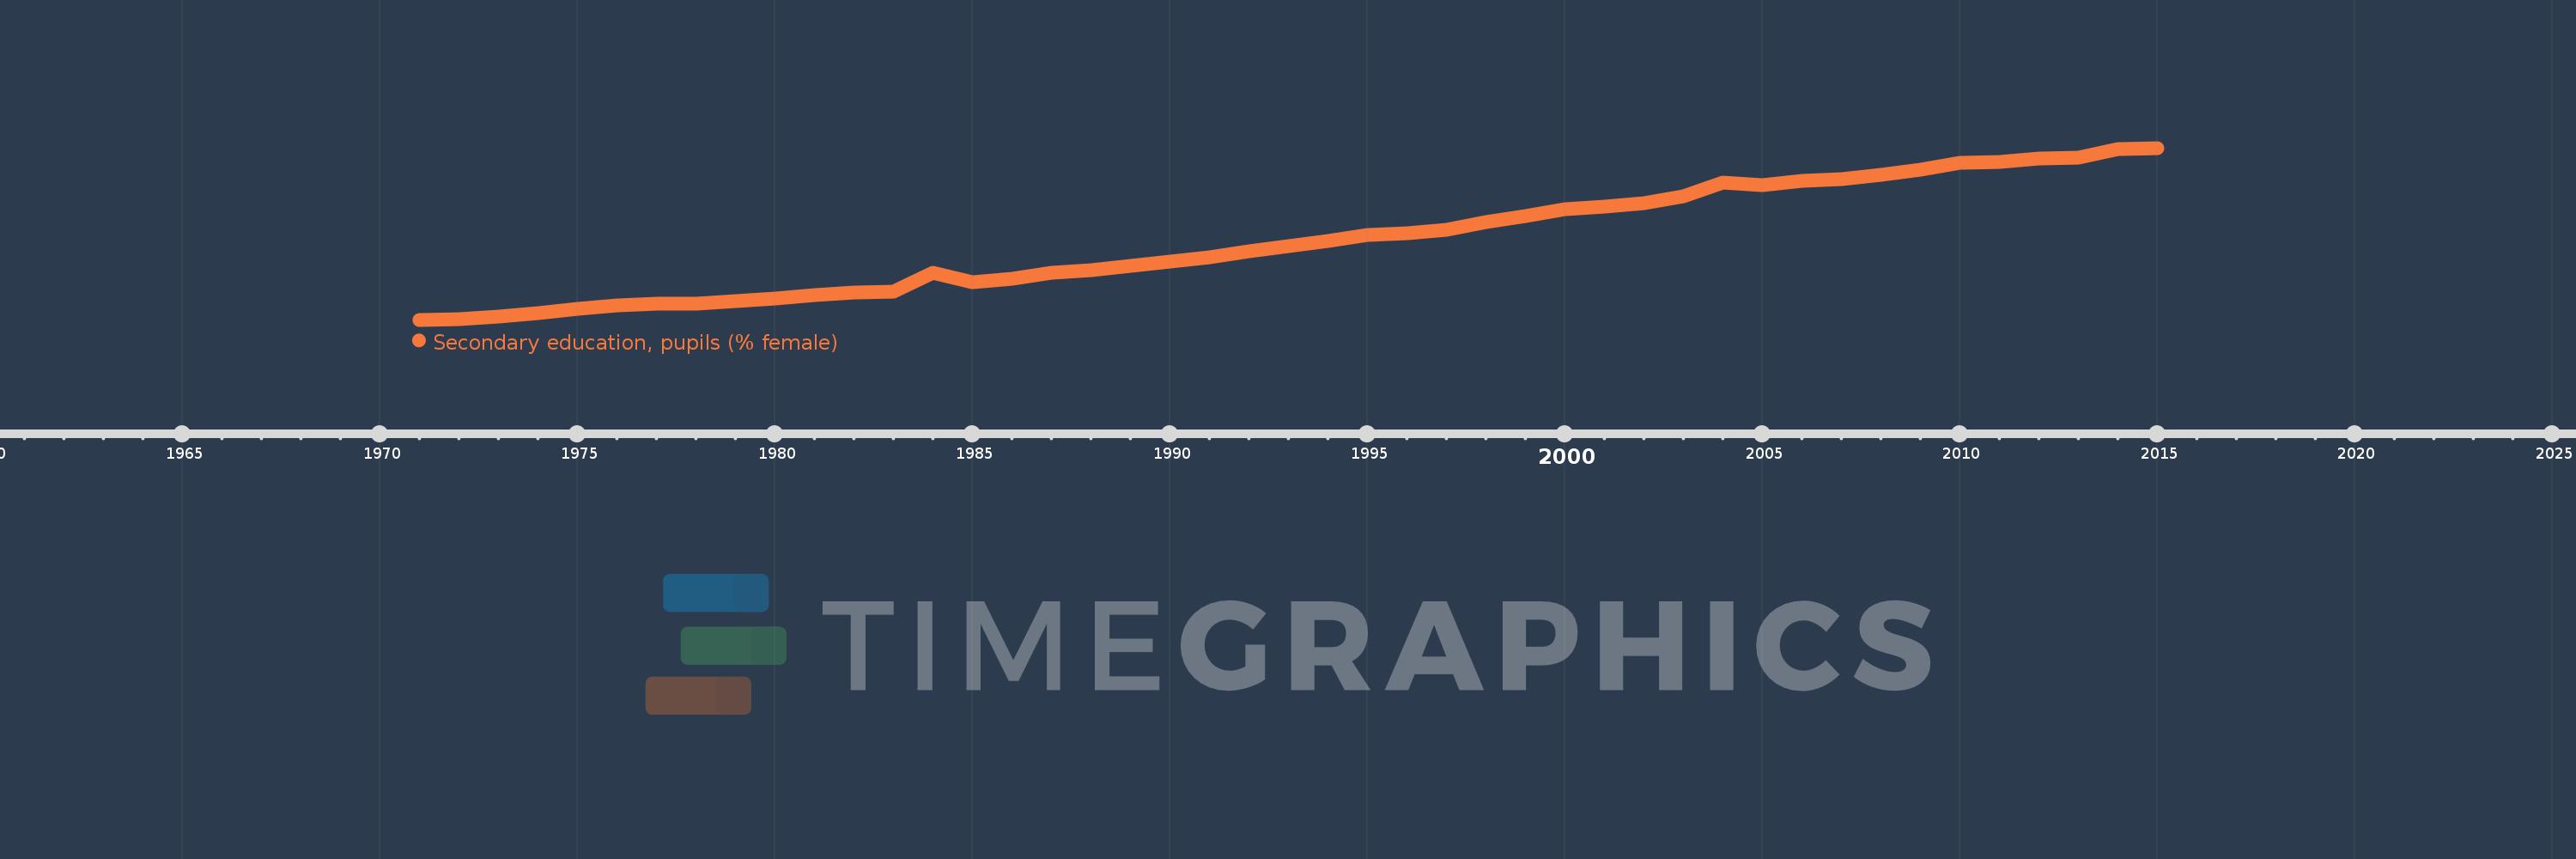
Secondary education, pupils (% female)
2015,2014,2013,2012,2011,2010,2009,2008,2007,2006,2005,2004,2003,2002,2001,2000,1999,1998,1997,1996,1995,1994,1993,1992,1991,1990,1989,1988,1987,1986,1985,1984,1983,1982,1981,1980,1979,1978,1977,1976,1975,1974,1973,1972,1971
This statistics in other country:
AfghanistanAlbaniaAlgeriaAndorraAngolaAntigua and BarbudaArab WorldArgentinaArmeniaArubaAustraliaAustriaAzerbaijanBahamas, TheBahrainBangladeshBarbadosBelarusBelgiumBelizeBeninBermudaBhutanBoliviaBosnia and HerzegovinaBotswanaBrazilBritish Virgin IslandsBrunei DarussalamBulgariaBurkina FasoBurundiCabo VerdeCambodiaCameroonCanadaCaribbean small statesCayman IslandsCentral African RepublicCentral Europe and the BalticsChadChileChinaColombiaComorosCongo, Dem. Rep.Congo, Rep.Costa RicaCote d'IvoireCroatiaCubaCuracaoCyprusCzech RepublicDenmarkDjiboutiDominicaDominican RepublicEarly-demographic dividendEast Asia & PacificEast Asia & Pacific (excluding high income)East Asia & Pacific (IDA & IBRD countries)EcuadorEgypt, Arab Rep.El SalvadorEquatorial GuineaEritreaEstoniaEthiopiaEuro areaEurope & Central AsiaEurope & Central Asia (excluding high income)Europe & Central Asia (IDA & IBRD countries)European UnionFijiFinlandFragile and conflict affected situationsFranceGabonGambia, TheGeorgiaGermanyGhanaGibraltarGreeceGrenadaGuatemalaGuineaGuinea-BissauGuyanaHeavily indebted poor countries (HIPC)High incomeHondurasHong Kong SAR, ChinaHungaryIBRD onlyIcelandIDA & IBRD totalIDA blendIDA onlyIDA totalIndiaIndonesiaIran, Islamic Rep.IraqIrelandIsraelItalyJamaicaJapanJordanKazakhstanKenyaKiribatiKorea, Dem. People’s Rep.Korea, Rep.KuwaitKyrgyz RepublicLao PDRLate-demographic dividendLatin America & Caribbean Latin America & Caribbean (excluding high income)Latin America & the Caribbean (IDA & IBRD countries)LatviaLeast developed countries: UN classificationLebanonLesothoLiberiaLibyaLiechtensteinLithuaniaLow & middle incomeLow incomeLower middle incomeLuxembourgMacao SAR, ChinaMacedonia, FYRMadagascarMalawiMalaysiaMaldivesMaliMaltaMarshall IslandsMauritaniaMauritiusMexicoMicronesia, Fed. Sts.Middle East & North AfricaMiddle East & North Africa (excluding high income)Middle East & North Africa (IDA & IBRD countries)Middle incomeMoldovaMonacoMongoliaMontenegroMoroccoMozambiqueMyanmarNamibiaNauruNepalNetherlandsNew ZealandNicaraguaNigerNigeriaNorth AmericaNorwayOECD membersOmanOther small statesPacific island small statesPakistanPalauPanamaPapua New GuineaParaguayPeruPhilippinesPolandPortugalPost-demographic dividendPre-demographic dividendPuerto RicoQatarRomaniaRussian FederationRwandaSamoaSan MarinoSao Tome and PrincipeSaudi ArabiaSenegalSerbiaSeychellesSierra LeoneSingaporeSint Maarten (Dutch part)Slovak RepublicSloveniaSmall statesSolomon IslandsSomaliaSouth AfricaSouth AsiaSouth Asia (IDA & IBRD)SpainSri LankaSt. Kitts and NevisSt. LuciaSt. Vincent and the GrenadinesSub-Saharan Africa Sub-Saharan Africa (excluding high income)Sub-Saharan Africa (IDA & IBRD countries)SudanSurinameSwazilandSwedenSwitzerlandSyrian Arab RepublicTajikistanTanzaniaThailandTimor-LesteTogoTongaTrinidad and TobagoTunisiaTurkeyTurkmenistanTurks and Caicos IslandsTuvaluUgandaUkraineUnited Arab EmiratesUnited KingdomUnited StatesUpper middle incomeUruguayUzbekistanVanuatuVenezuela, RBVietnamWest Bank and GazaWorldYemen, Rep.ZambiaZimbabwe Timeline:
This timeline shows a graph from 1971 to 2015 of South Asia. No data until 1970. Number of actual observations by date: 45.
Source name:
World Development Indicators
Source organization:
United Nations Educational, Scientific, and Cultural Organization (UNESCO) Institute for Statistics.
Categories, topics:
Education, Gender
Last updated:
apr 23, 2017
Indicators value changes by year
Minimum:
27.968
jan 1, 1971
Maximum:
47.374
jan 1, 2015
At the date of observation
Value
Absolute change
Change from previous value
jan 1, 1971
27.968
+27.968
0.0%
jan 1, 1972
27.994
+0.026
0.09%
jan 1, 1973
28.341
+0.347
1.24%
jan 1, 1974
28.74
+0.4
1.41%
jan 1, 1975
29.169
+0.428
1.49%
jan 1, 1976
29.616
+0.447
1.53%
jan 1, 1977
29.747
+0.132
0.44%
jan 1, 1978
29.806
+0.058
0.2%
jan 1, 1979
30.045
+0.239
0.8%
jan 1, 1980
30.349
+0.304
1.01%
jan 1, 1981
30.724
+0.375
1.24%
jan 1, 1982
31.06
+0.336
1.09%
jan 1, 1983
31.174
+0.114
0.37%
jan 1, 1984
33.276
+2.102
6.74%
jan 1, 1985
32.183
-1.093
-3.28%
jan 1, 1986
32.56
+0.377
1.17%
jan 1, 1987
33.267
+0.707
2.17%
jan 1, 1988
33.531
+0.263
0.79%
jan 1, 1989
34.041
+0.511
1.52%
jan 1, 1990
34.564
+0.523
1.54%
jan 1, 1991
35.028
+0.464
1.34%
jan 1, 1992
35.688
+0.66
1.88%
jan 1, 1993
36.266
+0.578
1.62%
jan 1, 1994
36.866
+0.6
1.65%
jan 1, 1995
37.521
+0.655
1.78%
jan 1, 1996
37.754
+0.233
0.62%
jan 1, 1997
38.143
+0.39
1.03%
jan 1, 1998
38.955
+0.812
2.13%
jan 1, 1999
39.71
+0.755
1.94%
jan 1, 2000
40.442
+0.732
1.84%
jan 1, 2001
40.771
+0.33
0.82%
jan 1, 2002
41.129
+0.358
0.88%
jan 1, 2003
41.927
+0.797
1.94%
jan 1, 2004
43.47
+1.543
3.68%
jan 1, 2005
43.204
-0.266
-0.61%
jan 1, 2006
43.69
+0.485
1.12%
jan 1, 2007
43.89
+0.2
0.46%
jan 1, 2008
44.366
+0.476
1.09%
jan 1, 2009
44.927
+0.561
1.26%
jan 1, 2010
45.672
+0.745
1.66%
jan 1, 2011
45.828
+0.156
0.34%
jan 1, 2012
46.154
+0.327
0.71%
jan 1, 2013
46.24
+0.085
0.18%
jan 1, 2014
47.256
+1.017
2.2%
jan 1, 2015
47.374
+0.118
0.25%
Ranking of countries by current statistics by years


Comments: