29
/
en
AIzaSyAYiBZKx7MnpbEhh9jyipgxe19OcubqV5w
April 1, 2024
156711
Indonesia
IDN
true
2
1
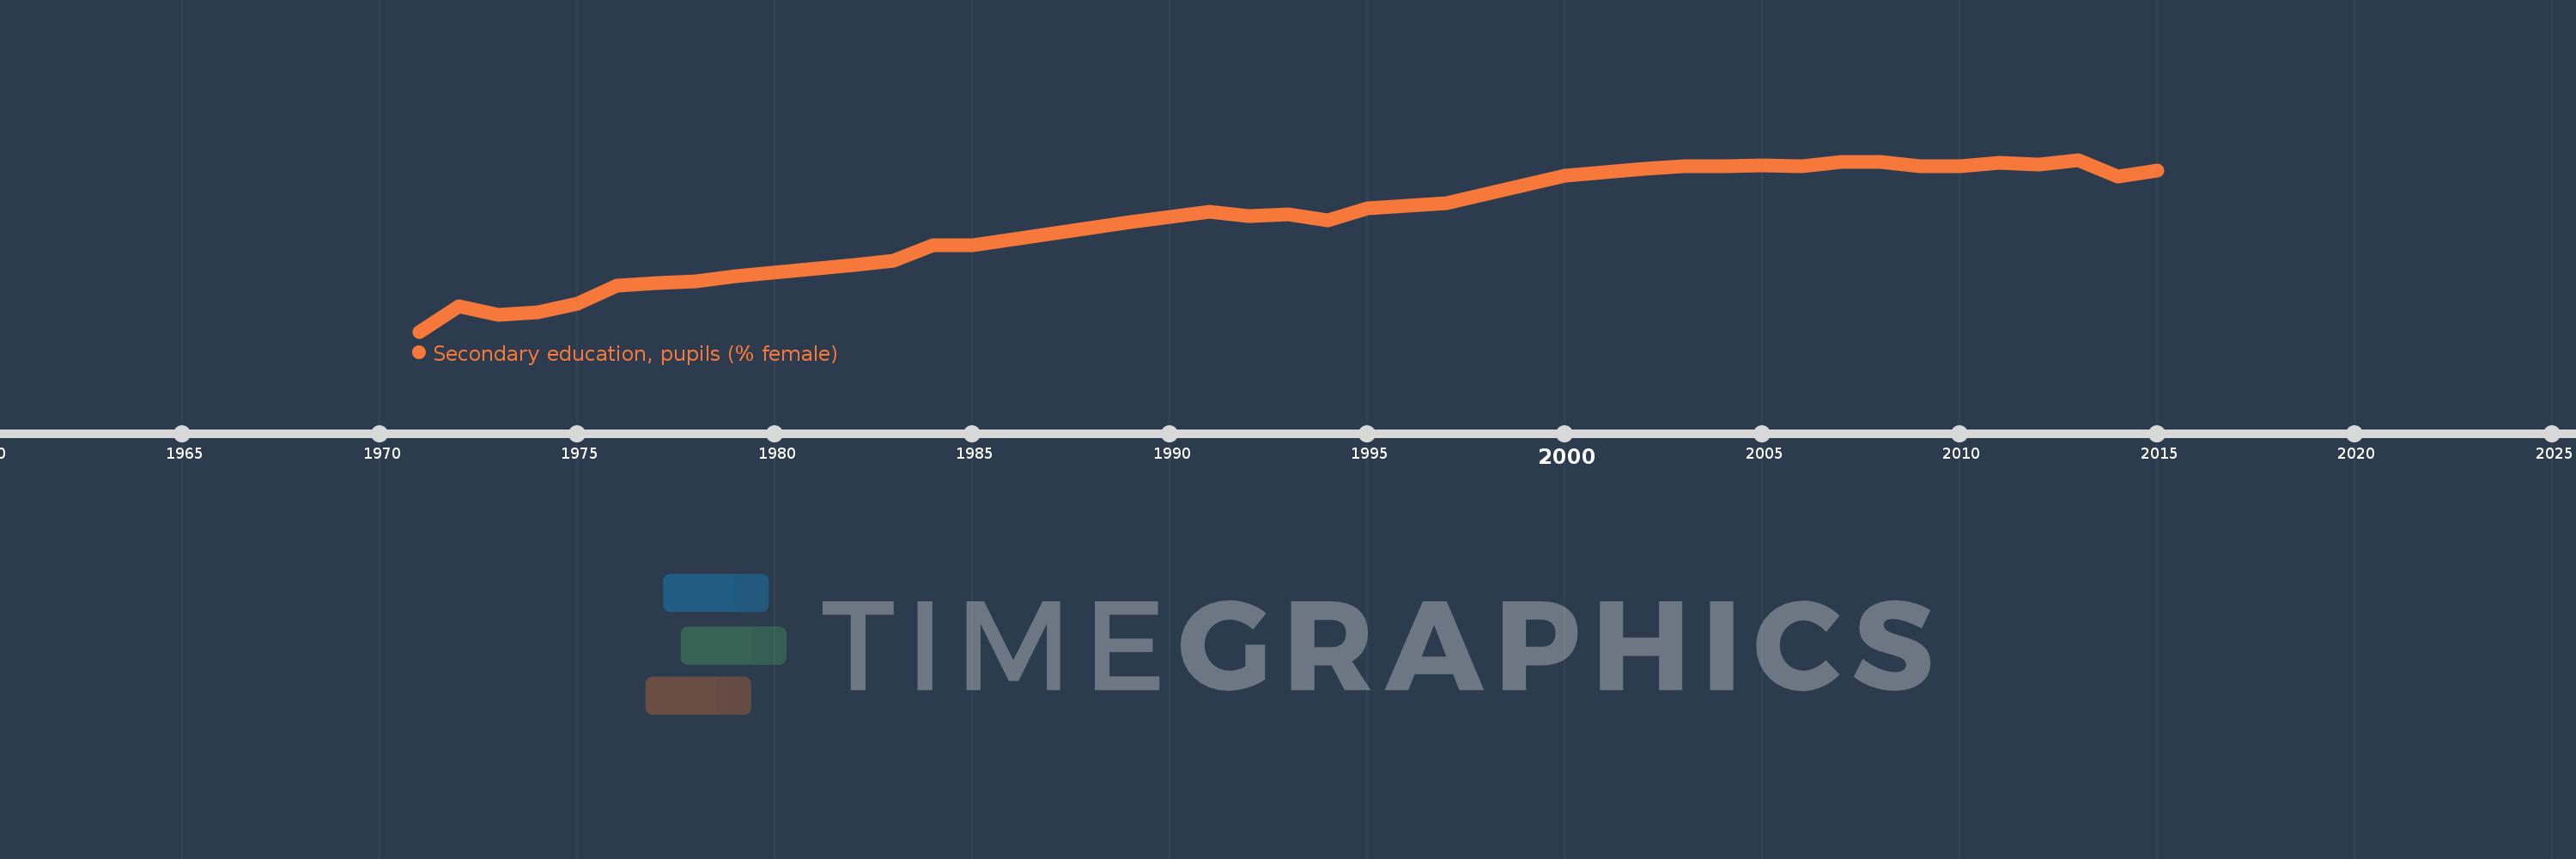
Secondary education, pupils (% female)
2015,2014,2013,2012,2011,2010,2009,2008,2007,2006,2005,2004,2003,2002,2001,2000,1997,1996,1995,1994,1993,1992,1991,1990,1989,1985,1984,1983,1982,1979,1978,1977,1976,1975,1974,1973,1972,1971
This statistics in other country:
AfghanistanAlbaniaAlgeriaAndorraAngolaAntigua and BarbudaArab WorldArgentinaArmeniaArubaAustraliaAustriaAzerbaijanBahamas, TheBahrainBangladeshBarbadosBelarusBelgiumBelizeBeninBermudaBhutanBoliviaBosnia and HerzegovinaBotswanaBrazilBritish Virgin IslandsBrunei DarussalamBulgariaBurkina FasoBurundiCabo VerdeCambodiaCameroonCanadaCaribbean small statesCayman IslandsCentral African RepublicCentral Europe and the BalticsChadChileChinaColombiaComorosCongo, Dem. Rep.Congo, Rep.Costa RicaCote d'IvoireCroatiaCubaCuracaoCyprusCzech RepublicDenmarkDjiboutiDominicaDominican RepublicEarly-demographic dividendEast Asia & PacificEast Asia & Pacific (excluding high income)East Asia & Pacific (IDA & IBRD countries)EcuadorEgypt, Arab Rep.El SalvadorEquatorial GuineaEritreaEstoniaEthiopiaEuro areaEurope & Central AsiaEurope & Central Asia (excluding high income)Europe & Central Asia (IDA & IBRD countries)European UnionFijiFinlandFragile and conflict affected situationsFranceGabonGambia, TheGeorgiaGermanyGhanaGibraltarGreeceGrenadaGuatemalaGuineaGuinea-BissauGuyanaHeavily indebted poor countries (HIPC)High incomeHondurasHong Kong SAR, ChinaHungaryIBRD onlyIcelandIDA & IBRD totalIDA blendIDA onlyIDA totalIndiaIndonesiaIran, Islamic Rep.IraqIrelandIsraelItalyJamaicaJapanJordanKazakhstanKenyaKiribatiKorea, Dem. People’s Rep.Korea, Rep.KuwaitKyrgyz RepublicLao PDRLate-demographic dividendLatin America & Caribbean Latin America & Caribbean (excluding high income)Latin America & the Caribbean (IDA & IBRD countries)LatviaLeast developed countries: UN classificationLebanonLesothoLiberiaLibyaLiechtensteinLithuaniaLow & middle incomeLow incomeLower middle incomeLuxembourgMacao SAR, ChinaMacedonia, FYRMadagascarMalawiMalaysiaMaldivesMaliMaltaMarshall IslandsMauritaniaMauritiusMexicoMicronesia, Fed. Sts.Middle East & North AfricaMiddle East & North Africa (excluding high income)Middle East & North Africa (IDA & IBRD countries)Middle incomeMoldovaMonacoMongoliaMontenegroMoroccoMozambiqueMyanmarNamibiaNauruNepalNetherlandsNew ZealandNicaraguaNigerNigeriaNorth AmericaNorwayOECD membersOmanOther small statesPacific island small statesPakistanPalauPanamaPapua New GuineaParaguayPeruPhilippinesPolandPortugalPost-demographic dividendPre-demographic dividendPuerto RicoQatarRomaniaRussian FederationRwandaSamoaSan MarinoSao Tome and PrincipeSaudi ArabiaSenegalSerbiaSeychellesSierra LeoneSingaporeSint Maarten (Dutch part)Slovak RepublicSloveniaSmall statesSolomon IslandsSomaliaSouth AfricaSouth AsiaSouth Asia (IDA & IBRD)SpainSri LankaSt. Kitts and NevisSt. LuciaSt. Vincent and the GrenadinesSub-Saharan Africa Sub-Saharan Africa (excluding high income)Sub-Saharan Africa (IDA & IBRD countries)SudanSurinameSwazilandSwedenSwitzerlandSyrian Arab RepublicTajikistanTanzaniaThailandTimor-LesteTogoTongaTrinidad and TobagoTunisiaTurkeyTurkmenistanTurks and Caicos IslandsTuvaluUgandaUkraineUnited Arab EmiratesUnited KingdomUnited StatesUpper middle incomeUruguayUzbekistanVanuatuVenezuela, RBVietnamWest Bank and GazaWorldYemen, Rep.ZambiaZimbabwe Timeline:
This timeline shows a graph from 1971 to 2015 of Indonesia. No data until 1970. Number of actual observations by date: 38.
Source name:
World Development Indicators
Source organization:
United Nations Educational, Scientific, and Cultural Organization (UNESCO) Institute for Statistics.
Categories, topics:
Education, Gender
Last updated:
apr 23, 2017
Indicators value changes by year
Maximum:
49.558
jan 1, 2013
At the date of observation
Value
Absolute change
Change from previous value
jan 1, 1971
34.17
+34.17
0.0%
jan 1, 1972
36.45
+2.281
6.67%
jan 1, 1973
35.682
-0.769
-2.11%
jan 1, 1974
35.933
+0.252
0.71%
jan 1, 1975
36.699
+0.766
2.13%
jan 1, 1976
38.267
+1.568
4.27%
jan 1, 1977
38.491
+0.224
0.59%
jan 1, 1978
38.662
+0.171
0.45%
jan 1, 1979
39.124
+0.462
1.19%
jan 1, 1982
40.125
+1.001
2.56%
jan 1, 1983
40.489
+0.364
0.91%
jan 1, 1984
41.903
+1.414
3.49%
jan 1, 1985
41.885
-0.019
-0.04%
jan 1, 1989
43.986
+2.101
5.02%
jan 1, 1990
44.414
+0.428
0.97%
jan 1, 1991
44.866
+0.452
1.02%
jan 1, 1992
44.528
-0.338
-0.75%
jan 1, 1993
44.648
+0.12
0.27%
jan 1, 1994
44.107
-0.541
-1.21%
jan 1, 1995
45.183
+1.076
2.44%
jan 1, 1996
45.458
+0.276
0.61%
jan 1, 1997
45.655
+0.196
0.43%
jan 1, 2000
48.113
+2.458
5.38%
jan 1, 2001
48.463
+0.351
0.73%
jan 1, 2002
48.784
+0.321
0.66%
jan 1, 2003
48.983
+0.199
0.41%
jan 1, 2004
48.971
-0.012
-0.02%
jan 1, 2005
49.071
+0.1
0.2%
jan 1, 2006
48.962
-0.108
-0.22%
jan 1, 2007
49.337
+0.375
0.77%
jan 1, 2008
49.351
+0.014
0.03%
jan 1, 2009
49.01
-0.341
-0.69%
jan 1, 2010
49.006
-0.003
-0.01%
jan 1, 2011
49.259
+0.253
0.52%
jan 1, 2012
49.134
-0.125
-0.25%
jan 1, 2013
49.558
+0.424
0.86%
jan 1, 2014
48.054
-1.504
-3.04%
jan 1, 2015
48.568
+0.515
1.07%
Ranking of countries by current statistics by years


Comments: