29
/
en
AIzaSyAYiBZKx7MnpbEhh9jyipgxe19OcubqV5w
April 1, 2024
43871
Latin America & the Caribbean (IDA & IBRD countries)
TLA
false
2
1
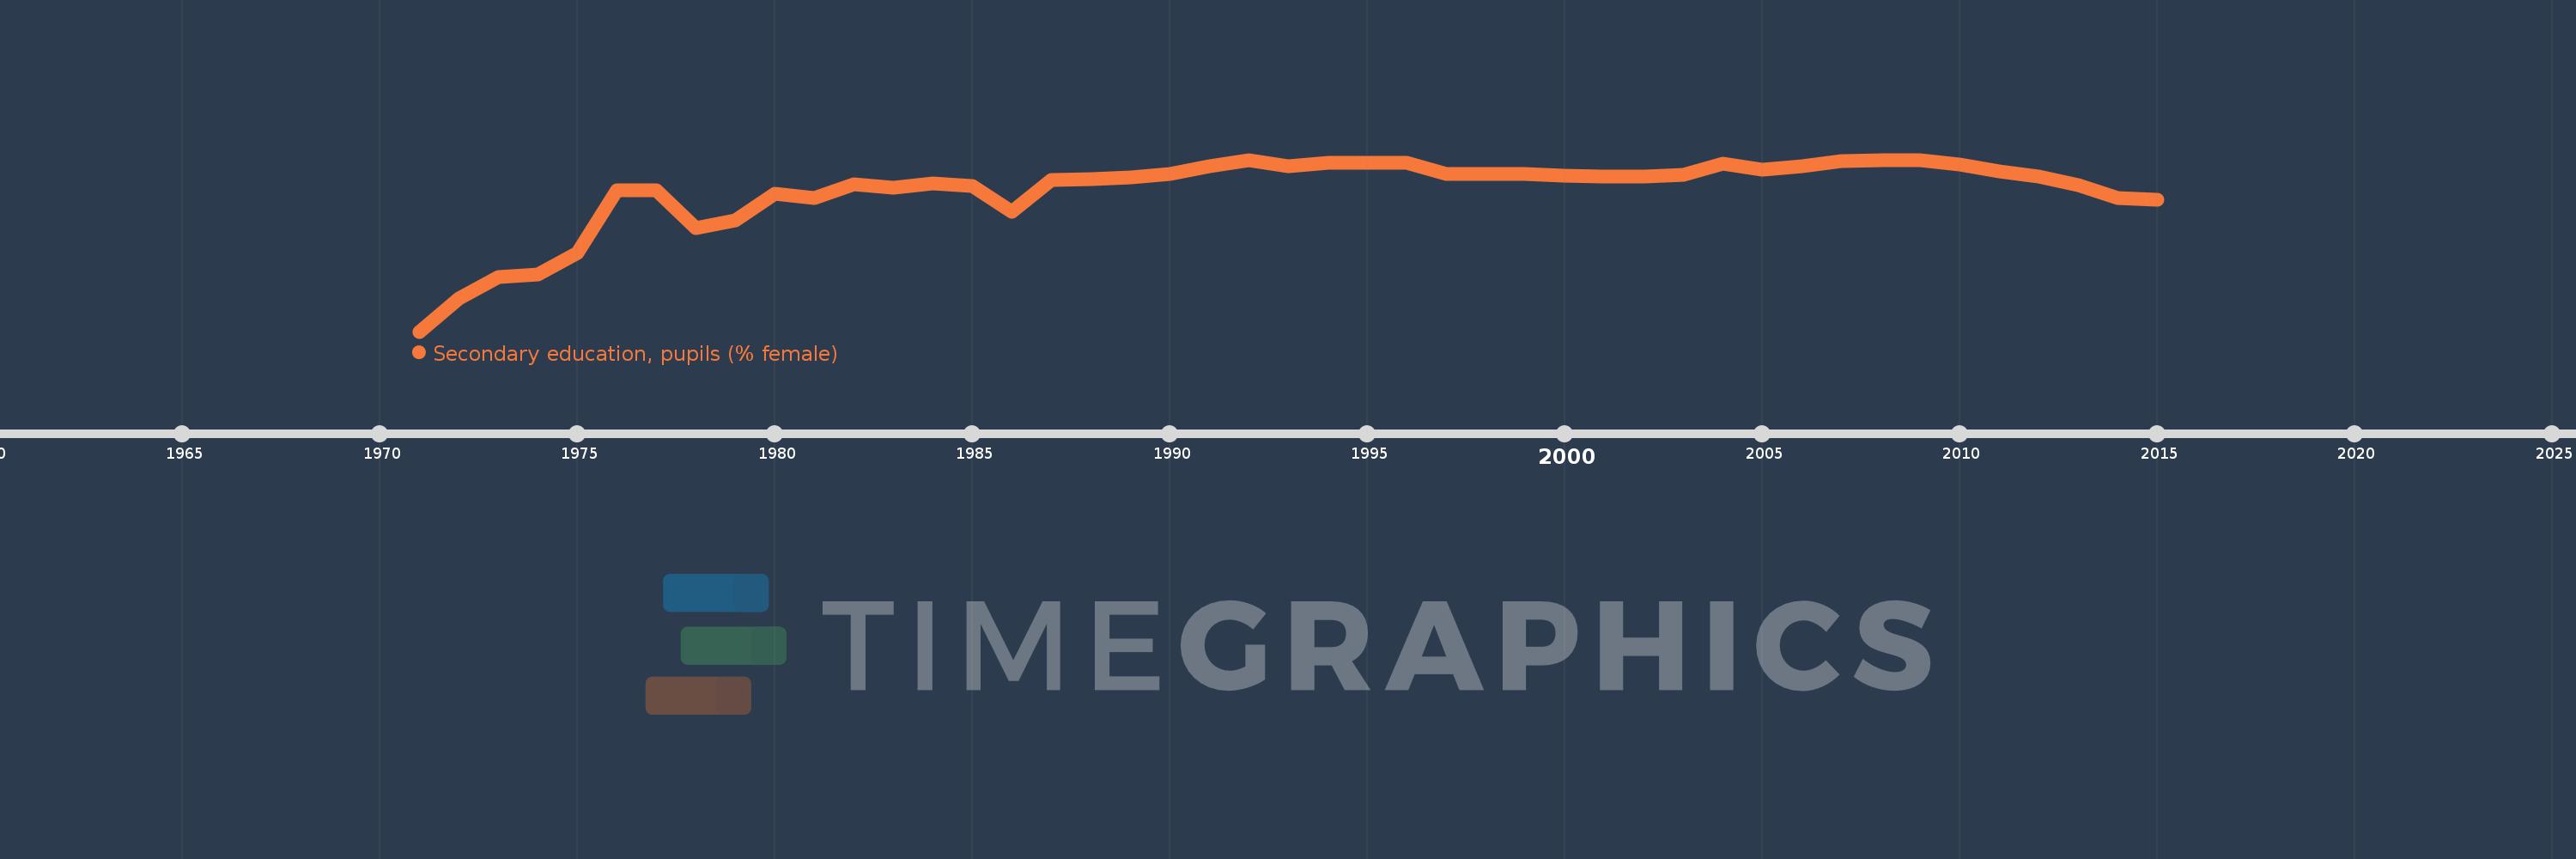
Secondary education, pupils (% female)
2015,2014,2013,2012,2011,2010,2009,2008,2007,2006,2005,2004,2003,2002,2001,2000,1999,1998,1997,1996,1995,1994,1993,1992,1991,1990,1989,1988,1987,1986,1985,1984,1983,1982,1981,1980,1979,1978,1977,1976,1975,1974,1973,1972,1971
This statistics in other country:
AfghanistanAlbaniaAlgeriaAndorraAngolaAntigua and BarbudaArab WorldArgentinaArmeniaArubaAustraliaAustriaAzerbaijanBahamas, TheBahrainBangladeshBarbadosBelarusBelgiumBelizeBeninBermudaBhutanBoliviaBosnia and HerzegovinaBotswanaBrazilBritish Virgin IslandsBrunei DarussalamBulgariaBurkina FasoBurundiCabo VerdeCambodiaCameroonCanadaCaribbean small statesCayman IslandsCentral African RepublicCentral Europe and the BalticsChadChileChinaColombiaComorosCongo, Dem. Rep.Congo, Rep.Costa RicaCote d'IvoireCroatiaCubaCuracaoCyprusCzech RepublicDenmarkDjiboutiDominicaDominican RepublicEarly-demographic dividendEast Asia & PacificEast Asia & Pacific (excluding high income)East Asia & Pacific (IDA & IBRD countries)EcuadorEgypt, Arab Rep.El SalvadorEquatorial GuineaEritreaEstoniaEthiopiaEuro areaEurope & Central AsiaEurope & Central Asia (excluding high income)Europe & Central Asia (IDA & IBRD countries)European UnionFijiFinlandFragile and conflict affected situationsFranceGabonGambia, TheGeorgiaGermanyGhanaGibraltarGreeceGrenadaGuatemalaGuineaGuinea-BissauGuyanaHeavily indebted poor countries (HIPC)High incomeHondurasHong Kong SAR, ChinaHungaryIBRD onlyIcelandIDA & IBRD totalIDA blendIDA onlyIDA totalIndiaIndonesiaIran, Islamic Rep.IraqIrelandIsraelItalyJamaicaJapanJordanKazakhstanKenyaKiribatiKorea, Dem. People’s Rep.Korea, Rep.KuwaitKyrgyz RepublicLao PDRLate-demographic dividendLatin America & Caribbean Latin America & Caribbean (excluding high income)Latin America & the Caribbean (IDA & IBRD countries)LatviaLeast developed countries: UN classificationLebanonLesothoLiberiaLibyaLiechtensteinLithuaniaLow & middle incomeLow incomeLower middle incomeLuxembourgMacao SAR, ChinaMacedonia, FYRMadagascarMalawiMalaysiaMaldivesMaliMaltaMarshall IslandsMauritaniaMauritiusMexicoMicronesia, Fed. Sts.Middle East & North AfricaMiddle East & North Africa (excluding high income)Middle East & North Africa (IDA & IBRD countries)Middle incomeMoldovaMonacoMongoliaMontenegroMoroccoMozambiqueMyanmarNamibiaNauruNepalNetherlandsNew ZealandNicaraguaNigerNigeriaNorth AmericaNorwayOECD membersOmanOther small statesPacific island small statesPakistanPalauPanamaPapua New GuineaParaguayPeruPhilippinesPolandPortugalPost-demographic dividendPre-demographic dividendPuerto RicoQatarRomaniaRussian FederationRwandaSamoaSan MarinoSao Tome and PrincipeSaudi ArabiaSenegalSerbiaSeychellesSierra LeoneSingaporeSint Maarten (Dutch part)Slovak RepublicSloveniaSmall statesSolomon IslandsSomaliaSouth AfricaSouth AsiaSouth Asia (IDA & IBRD)SpainSri LankaSt. Kitts and NevisSt. LuciaSt. Vincent and the GrenadinesSub-Saharan Africa Sub-Saharan Africa (excluding high income)Sub-Saharan Africa (IDA & IBRD countries)SudanSurinameSwazilandSwedenSwitzerlandSyrian Arab RepublicTajikistanTanzaniaThailandTimor-LesteTogoTongaTrinidad and TobagoTunisiaTurkeyTurkmenistanTurks and Caicos IslandsTuvaluUgandaUkraineUnited Arab EmiratesUnited KingdomUnited StatesUpper middle incomeUruguayUzbekistanVanuatuVenezuela, RBVietnamWest Bank and GazaWorldYemen, Rep.ZambiaZimbabwe Timeline:
This timeline shows a graph from 1971 to 2015 of Latin America & the Caribbean (IDA & IBRD countries). No data until 1970. Number of actual observations by date: 45.
Source name:
World Development Indicators
Source organization:
United Nations Educational, Scientific, and Cultural Organization (UNESCO) Institute for Statistics.
Categories, topics:
Education, Gender
Last updated:
apr 23, 2017
Indicators value changes by year
Minimum:
48.192
jan 1, 1971
Maximum:
51.318
jan 1, 2009
At the date of observation
Value
Absolute change
Change from previous value
jan 1, 1971
48.192
+48.192
0.0%
jan 1, 1972
48.793
+0.601
1.25%
jan 1, 1973
49.192
+0.399
0.82%
jan 1, 1974
49.23
+0.037
0.08%
jan 1, 1975
49.628
+0.398
0.81%
jan 1, 1976
50.756
+1.128
2.27%
jan 1, 1977
50.763
+0.008
0.01%
jan 1, 1978
50.081
-0.682
-1.34%
jan 1, 1979
50.22
+0.139
0.28%
jan 1, 1980
50.693
+0.473
0.94%
jan 1, 1981
50.627
-0.065
-0.13%
jan 1, 1982
50.872
+0.244
0.48%
jan 1, 1983
50.81
-0.062
-0.12%
jan 1, 1984
50.894
+0.084
0.17%
jan 1, 1985
50.847
-0.047
-0.09%
jan 1, 1986
50.37
-0.477
-0.94%
jan 1, 1987
50.953
+0.582
1.16%
jan 1, 1988
50.96
+0.008
0.02%
jan 1, 1989
51.001
+0.041
0.08%
jan 1, 1990
51.053
+0.052
0.1%
jan 1, 1991
51.193
+0.141
0.28%
jan 1, 1992
51.31
+0.116
0.23%
jan 1, 1993
51.208
-0.102
-0.2%
jan 1, 1994
51.259
+0.051
0.1%
jan 1, 1995
51.264
+0.005
0.01%
jan 1, 1996
51.256
-0.008
-0.02%
jan 1, 1997
51.061
-0.195
-0.38%
jan 1, 1998
51.057
-0.005
-0.01%
jan 1, 1999
51.055
-0.001
0.0%
jan 1, 2000
51.031
-0.024
-0.05%
jan 1, 2001
51.01
-0.022
-0.04%
jan 1, 2002
51.021
+0.011
0.02%
jan 1, 2003
51.052
+0.031
0.06%
jan 1, 2004
51.244
+0.192
0.38%
jan 1, 2005
51.145
-0.099
-0.19%
jan 1, 2006
51.194
+0.05
0.1%
jan 1, 2007
51.29
+0.095
0.19%
jan 1, 2008
51.306
+0.016
0.03%
jan 1, 2009
51.318
+0.013
0.02%
jan 1, 2010
51.234
-0.084
-0.16%
jan 1, 2011
51.106
-0.128
-0.25%
jan 1, 2012
51.009
-0.097
-0.19%
jan 1, 2013
50.856
-0.152
-0.3%
jan 1, 2014
50.626
-0.23
-0.45%
jan 1, 2015
50.596
-0.03
-0.06%
Ranking of countries by current statistics by years


Comments: