29
/
en
AIzaSyAYiBZKx7MnpbEhh9jyipgxe19OcubqV5w
April 1, 2024
168199
Kenya
KEN
true
2
1
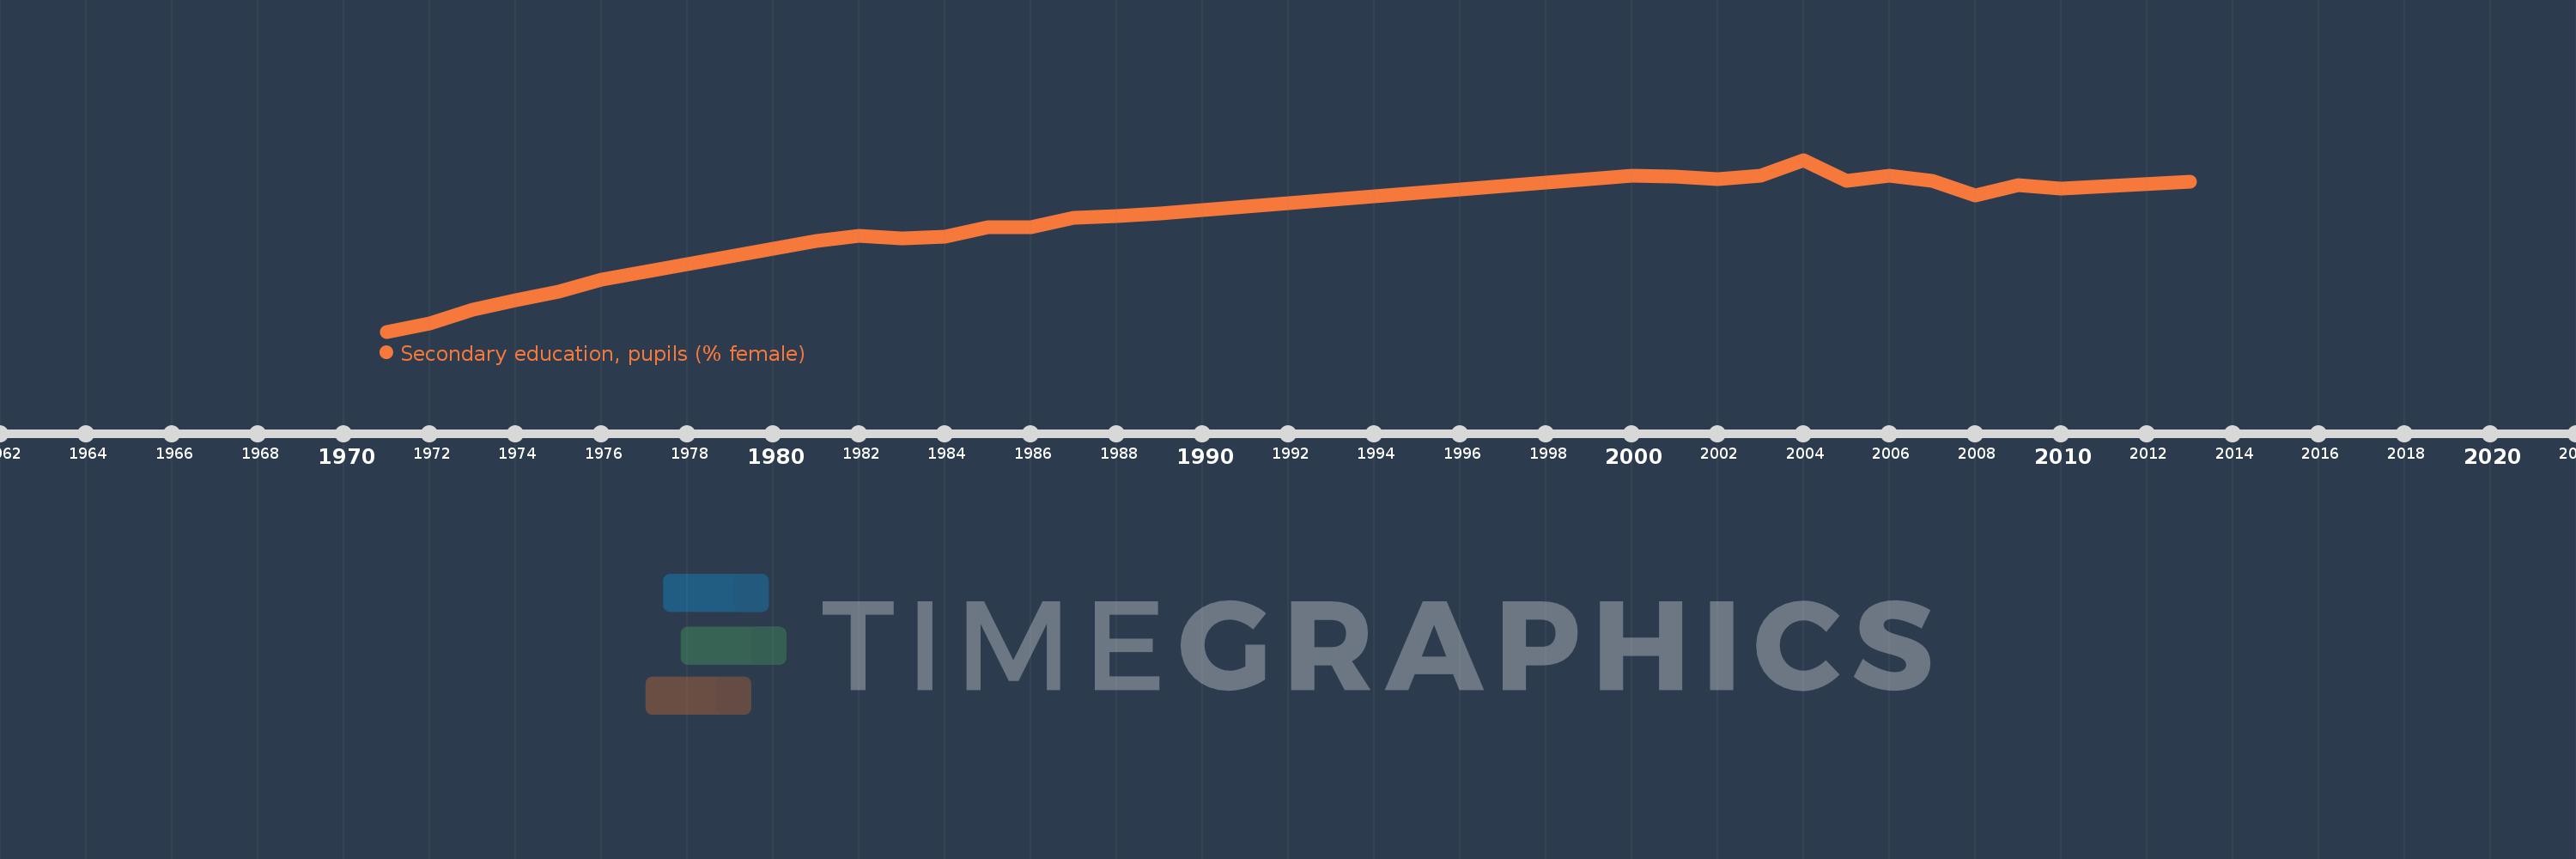
Secondary education, pupils (% female)
2013,2010,2009,2008,2007,2006,2005,2004,2003,2002,2001,2000,1989,1988,1987,1986,1985,1984,1983,1982,1981,1976,1975,1974,1973,1972,1971
This statistics in other country:
AfghanistanAlbaniaAlgeriaAndorraAngolaAntigua and BarbudaArab WorldArgentinaArmeniaArubaAustraliaAustriaAzerbaijanBahamas, TheBahrainBangladeshBarbadosBelarusBelgiumBelizeBeninBermudaBhutanBoliviaBosnia and HerzegovinaBotswanaBrazilBritish Virgin IslandsBrunei DarussalamBulgariaBurkina FasoBurundiCabo VerdeCambodiaCameroonCanadaCaribbean small statesCayman IslandsCentral African RepublicCentral Europe and the BalticsChadChileChinaColombiaComorosCongo, Dem. Rep.Congo, Rep.Costa RicaCote d'IvoireCroatiaCubaCuracaoCyprusCzech RepublicDenmarkDjiboutiDominicaDominican RepublicEarly-demographic dividendEast Asia & PacificEast Asia & Pacific (excluding high income)East Asia & Pacific (IDA & IBRD countries)EcuadorEgypt, Arab Rep.El SalvadorEquatorial GuineaEritreaEstoniaEthiopiaEuro areaEurope & Central AsiaEurope & Central Asia (excluding high income)Europe & Central Asia (IDA & IBRD countries)European UnionFijiFinlandFragile and conflict affected situationsFranceGabonGambia, TheGeorgiaGermanyGhanaGibraltarGreeceGrenadaGuatemalaGuineaGuinea-BissauGuyanaHeavily indebted poor countries (HIPC)High incomeHondurasHong Kong SAR, ChinaHungaryIBRD onlyIcelandIDA & IBRD totalIDA blendIDA onlyIDA totalIndiaIndonesiaIran, Islamic Rep.IraqIrelandIsraelItalyJamaicaJapanJordanKazakhstanKenyaKiribatiKorea, Dem. People’s Rep.Korea, Rep.KuwaitKyrgyz RepublicLao PDRLate-demographic dividendLatin America & Caribbean Latin America & Caribbean (excluding high income)Latin America & the Caribbean (IDA & IBRD countries)LatviaLeast developed countries: UN classificationLebanonLesothoLiberiaLibyaLiechtensteinLithuaniaLow & middle incomeLow incomeLower middle incomeLuxembourgMacao SAR, ChinaMacedonia, FYRMadagascarMalawiMalaysiaMaldivesMaliMaltaMarshall IslandsMauritaniaMauritiusMexicoMicronesia, Fed. Sts.Middle East & North AfricaMiddle East & North Africa (excluding high income)Middle East & North Africa (IDA & IBRD countries)Middle incomeMoldovaMonacoMongoliaMontenegroMoroccoMozambiqueMyanmarNamibiaNauruNepalNetherlandsNew ZealandNicaraguaNigerNigeriaNorth AmericaNorwayOECD membersOmanOther small statesPacific island small statesPakistanPalauPanamaPapua New GuineaParaguayPeruPhilippinesPolandPortugalPost-demographic dividendPre-demographic dividendPuerto RicoQatarRomaniaRussian FederationRwandaSamoaSan MarinoSao Tome and PrincipeSaudi ArabiaSenegalSerbiaSeychellesSierra LeoneSingaporeSint Maarten (Dutch part)Slovak RepublicSloveniaSmall statesSolomon IslandsSomaliaSouth AfricaSouth AsiaSouth Asia (IDA & IBRD)SpainSri LankaSt. Kitts and NevisSt. LuciaSt. Vincent and the GrenadinesSub-Saharan Africa Sub-Saharan Africa (excluding high income)Sub-Saharan Africa (IDA & IBRD countries)SudanSurinameSwazilandSwedenSwitzerlandSyrian Arab RepublicTajikistanTanzaniaThailandTimor-LesteTogoTongaTrinidad and TobagoTunisiaTurkeyTurkmenistanTurks and Caicos IslandsTuvaluUgandaUkraineUnited Arab EmiratesUnited KingdomUnited StatesUpper middle incomeUruguayUzbekistanVanuatuVenezuela, RBVietnamWest Bank and GazaWorldYemen, Rep.ZambiaZimbabwe Timeline:
This timeline shows a graph from 1971 to 2013 of Kenya. No data until 1970. Number of actual observations by date: 27.
Source name:
World Development Indicators
Source organization:
United Nations Educational, Scientific, and Cultural Organization (UNESCO) Institute for Statistics.
Categories, topics:
Education, Gender
Last updated:
apr 23, 2017
Indicators value changes by year
Minimum:
31.436
jan 1, 1971
Maximum:
50.395
jan 1, 2004
At the date of observation
Value
Absolute change
Change from previous value
jan 1, 1971
31.436
+31.436
0.0%
jan 1, 1972
32.382
+0.946
3.01%
jan 1, 1973
33.873
+1.491
4.61%
jan 1, 1974
34.869
+0.996
2.94%
jan 1, 1975
35.805
+0.936
2.68%
jan 1, 1976
37.196
+1.391
3.88%
jan 1, 1981
41.46
+4.265
11.47%
jan 1, 1982
41.998
+0.537
1.3%
jan 1, 1983
41.75
-0.247
-0.59%
jan 1, 1984
41.916
+0.166
0.4%
jan 1, 1985
42.953
+1.037
2.47%
jan 1, 1986
42.929
-0.023
-0.05%
jan 1, 1987
44.014
+1.084
2.53%
jan 1, 1988
44.217
+0.203
0.46%
jan 1, 1989
44.436
+0.219
0.49%
jan 1, 2000
48.672
+4.236
9.53%
jan 1, 2001
48.536
-0.136
-0.28%
jan 1, 2002
48.221
-0.315
-0.65%
jan 1, 2003
48.668
+0.448
0.93%
jan 1, 2004
50.395
+1.727
3.55%
jan 1, 2005
48.074
-2.321
-4.61%
jan 1, 2006
48.621
+0.548
1.14%
jan 1, 2007
48.089
-0.532
-1.09%
jan 1, 2008
46.453
-1.636
-3.4%
jan 1, 2009
47.604
+1.151
2.48%
jan 1, 2010
47.264
-0.34
-0.71%
jan 1, 2013
47.962
+0.698
1.48%
Ranking of countries by current statistics by years


Comments: