29
/
en
AIzaSyAYiBZKx7MnpbEhh9jyipgxe19OcubqV5w
April 1, 2024
142311
Greece
GRC
true
2
1
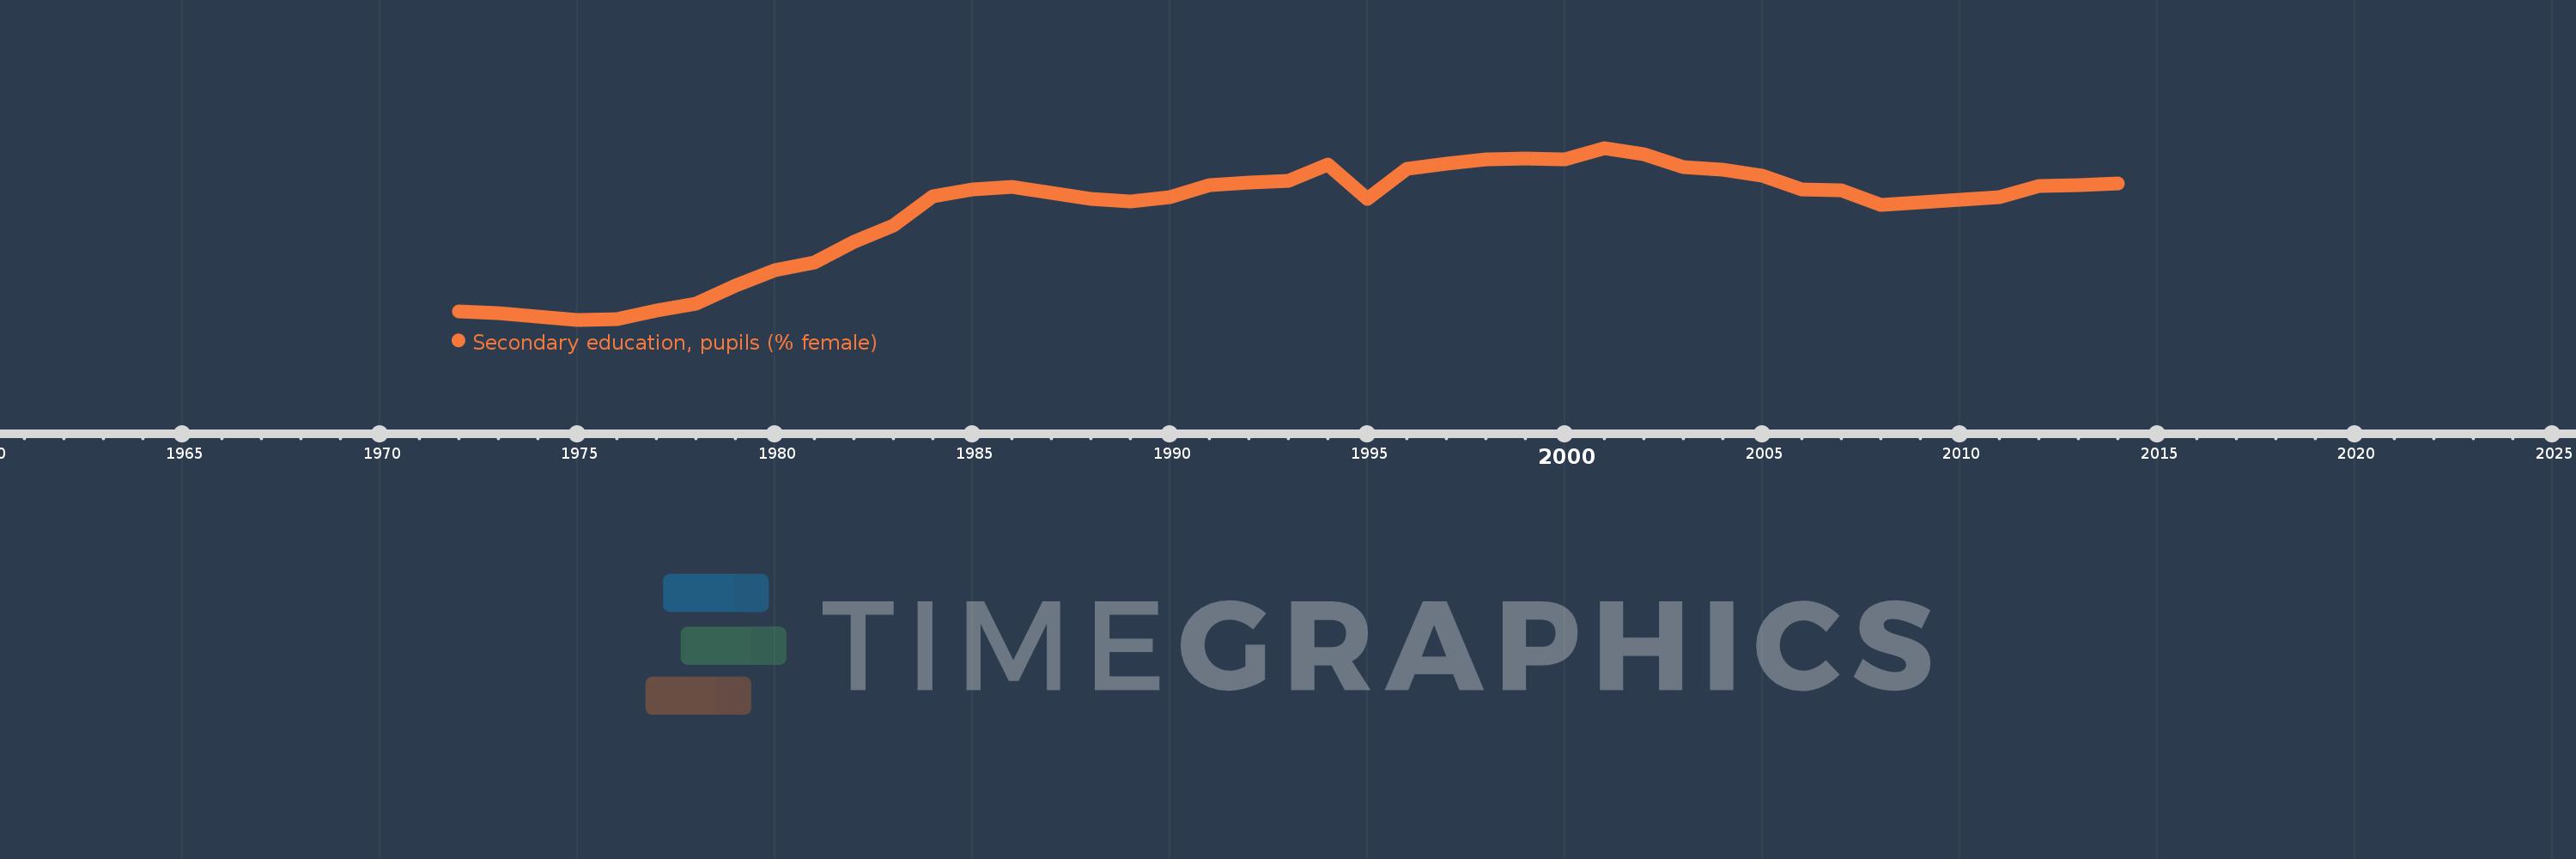
Secondary education, pupils (% female)
2014,2013,2012,2011,2008,2007,2006,2005,2004,2003,2002,2001,2000,1999,1998,1997,1996,1995,1994,1993,1992,1991,1990,1989,1988,1987,1986,1985,1984,1983,1982,1981,1980,1979,1978,1977,1976,1975,1974,1973,1972
This statistics in other country:
AfghanistanAlbaniaAlgeriaAndorraAngolaAntigua and BarbudaArab WorldArgentinaArmeniaArubaAustraliaAustriaAzerbaijanBahamas, TheBahrainBangladeshBarbadosBelarusBelgiumBelizeBeninBermudaBhutanBoliviaBosnia and HerzegovinaBotswanaBrazilBritish Virgin IslandsBrunei DarussalamBulgariaBurkina FasoBurundiCabo VerdeCambodiaCameroonCanadaCaribbean small statesCayman IslandsCentral African RepublicCentral Europe and the BalticsChadChileChinaColombiaComorosCongo, Dem. Rep.Congo, Rep.Costa RicaCote d'IvoireCroatiaCubaCuracaoCyprusCzech RepublicDenmarkDjiboutiDominicaDominican RepublicEarly-demographic dividendEast Asia & PacificEast Asia & Pacific (excluding high income)East Asia & Pacific (IDA & IBRD countries)EcuadorEgypt, Arab Rep.El SalvadorEquatorial GuineaEritreaEstoniaEthiopiaEuro areaEurope & Central AsiaEurope & Central Asia (excluding high income)Europe & Central Asia (IDA & IBRD countries)European UnionFijiFinlandFragile and conflict affected situationsFranceGabonGambia, TheGeorgiaGermanyGhanaGibraltarGreeceGrenadaGuatemalaGuineaGuinea-BissauGuyanaHeavily indebted poor countries (HIPC)High incomeHondurasHong Kong SAR, ChinaHungaryIBRD onlyIcelandIDA & IBRD totalIDA blendIDA onlyIDA totalIndiaIndonesiaIran, Islamic Rep.IraqIrelandIsraelItalyJamaicaJapanJordanKazakhstanKenyaKiribatiKorea, Dem. People’s Rep.Korea, Rep.KuwaitKyrgyz RepublicLao PDRLate-demographic dividendLatin America & Caribbean Latin America & Caribbean (excluding high income)Latin America & the Caribbean (IDA & IBRD countries)LatviaLeast developed countries: UN classificationLebanonLesothoLiberiaLibyaLiechtensteinLithuaniaLow & middle incomeLow incomeLower middle incomeLuxembourgMacao SAR, ChinaMacedonia, FYRMadagascarMalawiMalaysiaMaldivesMaliMaltaMarshall IslandsMauritaniaMauritiusMexicoMicronesia, Fed. Sts.Middle East & North AfricaMiddle East & North Africa (excluding high income)Middle East & North Africa (IDA & IBRD countries)Middle incomeMoldovaMonacoMongoliaMontenegroMoroccoMozambiqueMyanmarNamibiaNauruNepalNetherlandsNew ZealandNicaraguaNigerNigeriaNorth AmericaNorwayOECD membersOmanOther small statesPacific island small statesPakistanPalauPanamaPapua New GuineaParaguayPeruPhilippinesPolandPortugalPost-demographic dividendPre-demographic dividendPuerto RicoQatarRomaniaRussian FederationRwandaSamoaSan MarinoSao Tome and PrincipeSaudi ArabiaSenegalSerbiaSeychellesSierra LeoneSingaporeSint Maarten (Dutch part)Slovak RepublicSloveniaSmall statesSolomon IslandsSomaliaSouth AfricaSouth AsiaSouth Asia (IDA & IBRD)SpainSri LankaSt. Kitts and NevisSt. LuciaSt. Vincent and the GrenadinesSub-Saharan Africa Sub-Saharan Africa (excluding high income)Sub-Saharan Africa (IDA & IBRD countries)SudanSurinameSwazilandSwedenSwitzerlandSyrian Arab RepublicTajikistanTanzaniaThailandTimor-LesteTogoTongaTrinidad and TobagoTunisiaTurkeyTurkmenistanTurks and Caicos IslandsTuvaluUgandaUkraineUnited Arab EmiratesUnited KingdomUnited StatesUpper middle incomeUruguayUzbekistanVanuatuVenezuela, RBVietnamWest Bank and GazaWorldYemen, Rep.ZambiaZimbabwe Timeline:
This timeline shows a graph from 1972 to 2014 of Greece. No data until 1971. Number of actual observations by date: 41.
Source name:
World Development Indicators
Source organization:
United Nations Educational, Scientific, and Cultural Organization (UNESCO) Institute for Statistics.
Categories, topics:
Education, Gender
Last updated:
apr 23, 2017
Indicators value changes by year
Minimum:
42.524
jan 1, 1975
Maximum:
49.381
jan 1, 2001
At the date of observation
Value
Absolute change
Change from previous value
jan 1, 1972
42.849
+42.849
0.0%
jan 1, 1973
42.783
-0.066
-0.15%
jan 1, 1974
42.64
-0.143
-0.34%
jan 1, 1975
42.524
-0.115
-0.27%
jan 1, 1976
42.556
+0.032
0.08%
jan 1, 1977
42.892
+0.335
0.79%
jan 1, 1978
43.176
+0.284
0.66%
jan 1, 1979
43.896
+0.721
1.67%
jan 1, 1980
44.497
+0.601
1.37%
jan 1, 1981
44.813
+0.316
0.71%
jan 1, 1982
45.647
+0.834
1.86%
jan 1, 1983
46.293
+0.646
1.41%
jan 1, 1984
47.458
+1.165
2.52%
jan 1, 1985
47.732
+0.275
0.58%
jan 1, 1986
47.814
+0.082
0.17%
jan 1, 1987
47.587
-0.228
-0.48%
jan 1, 1988
47.362
-0.224
-0.47%
jan 1, 1989
47.245
-0.117
-0.25%
jan 1, 1990
47.406
+0.161
0.34%
jan 1, 1991
47.883
+0.476
1.0%
jan 1, 1992
47.992
+0.109
0.23%
jan 1, 1993
48.077
+0.085
0.18%
jan 1, 1994
48.712
+0.635
1.32%
jan 1, 1995
47.35
-1.362
-2.8%
jan 1, 1996
48.553
+1.203
2.54%
jan 1, 1997
48.767
+0.214
0.44%
jan 1, 1998
48.938
+0.17
0.35%
jan 1, 1999
48.972
+0.035
0.07%
jan 1, 2000
48.934
-0.039
-0.08%
jan 1, 2001
49.381
+0.447
0.91%
jan 1, 2002
49.114
-0.267
-0.54%
jan 1, 2003
48.606
-0.508
-1.03%
jan 1, 2004
48.526
-0.08
-0.16%
jan 1, 2005
48.271
-0.255
-0.53%
jan 1, 2006
47.72
-0.551
-1.14%
jan 1, 2007
47.705
-0.015
-0.03%
jan 1, 2008
47.106
-0.599
-1.25%
jan 1, 2011
47.41
+0.304
0.65%
jan 1, 2012
47.861
+0.45
0.95%
jan 1, 2013
47.903
+0.043
0.09%
jan 1, 2014
47.97
+0.067
0.14%
Ranking of countries by current statistics by years


Comments: