29
/
en
AIzaSyAYiBZKx7MnpbEhh9jyipgxe19OcubqV5w
April 1, 2024
238730
Seychelles
SYC
true
2
1
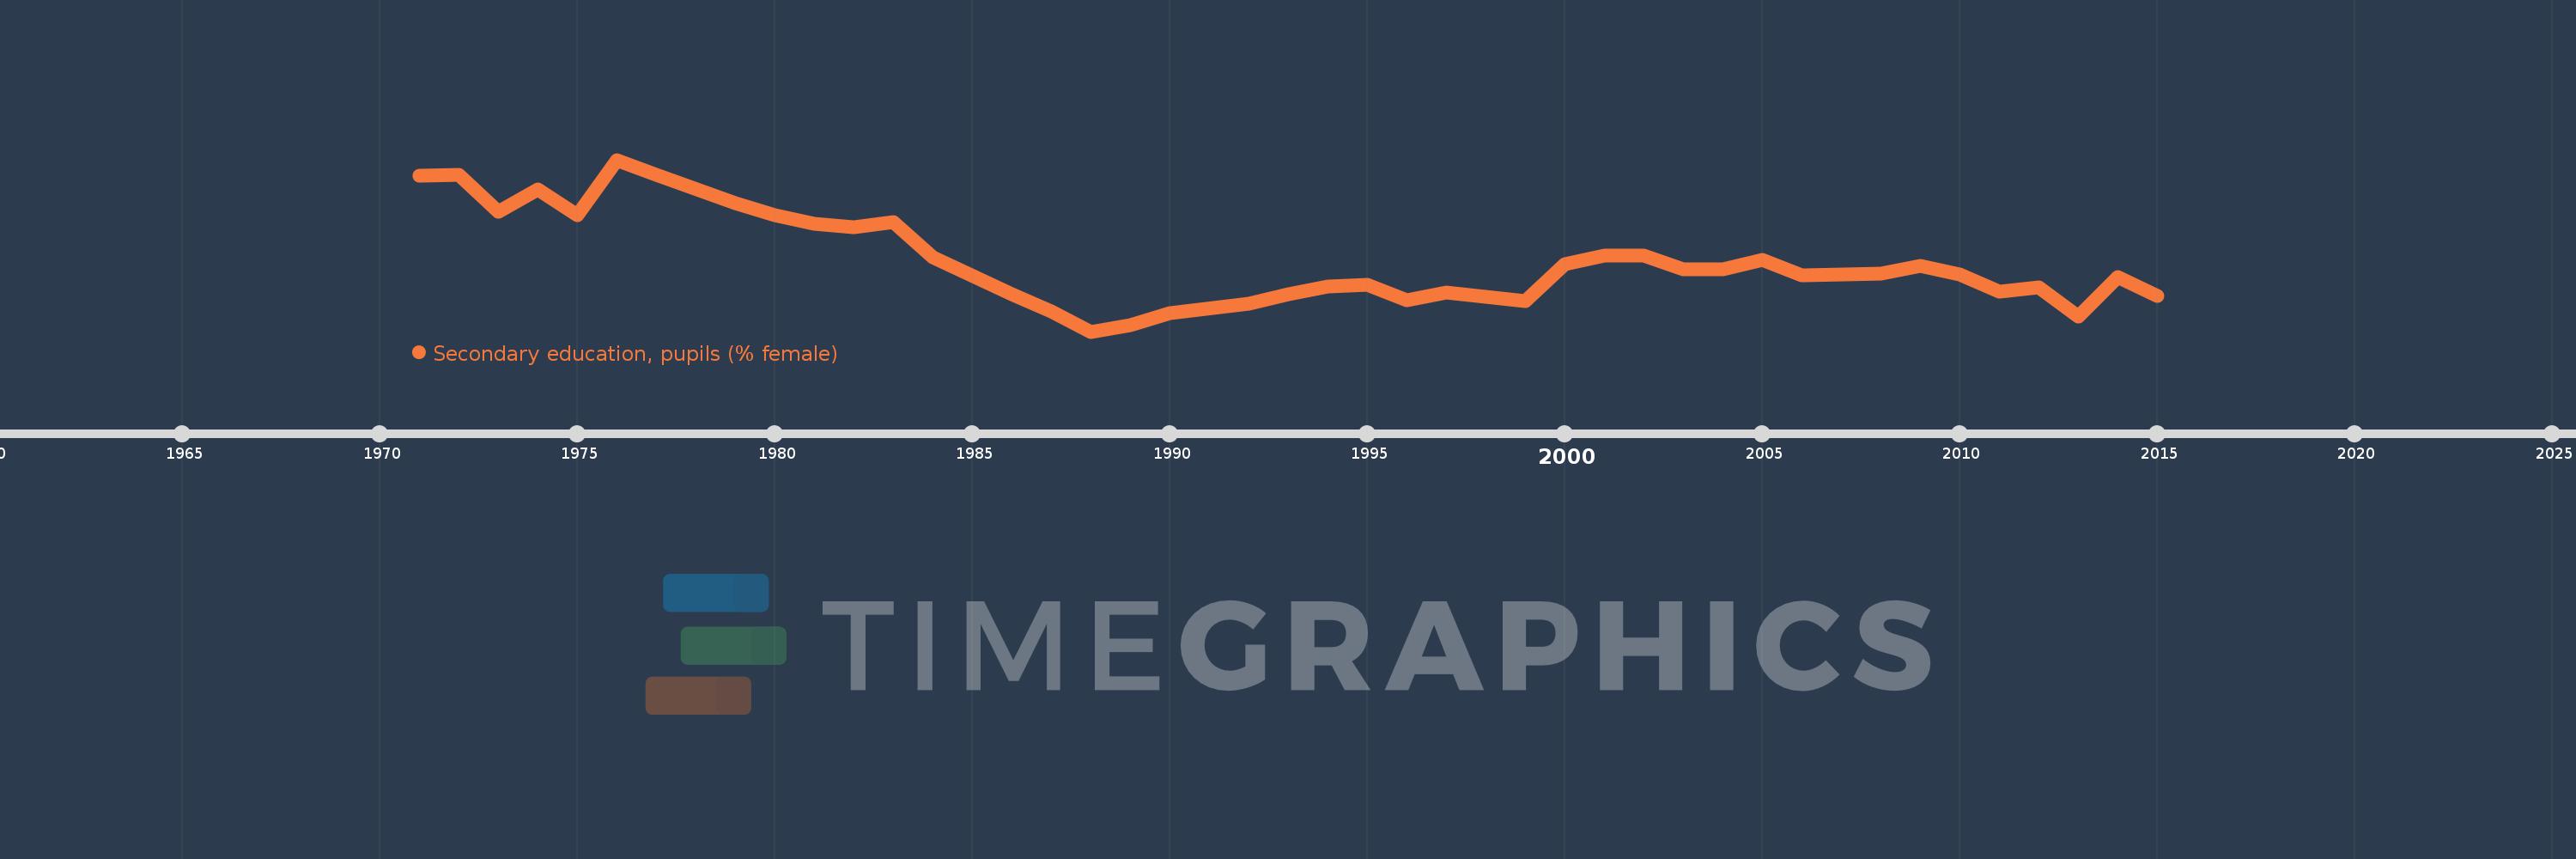
Secondary education, pupils (% female)
2015,2014,2013,2012,2011,2010,2009,2008,2006,2005,2004,2003,2002,2001,2000,1999,1997,1996,1995,1994,1993,1992,1990,1989,1988,1987,1986,1984,1983,1982,1981,1980,1979,1977,1976,1975,1974,1973,1972,1971
This statistics in other country:
AfghanistanAlbaniaAlgeriaAndorraAngolaAntigua and BarbudaArab WorldArgentinaArmeniaArubaAustraliaAustriaAzerbaijanBahamas, TheBahrainBangladeshBarbadosBelarusBelgiumBelizeBeninBermudaBhutanBoliviaBosnia and HerzegovinaBotswanaBrazilBritish Virgin IslandsBrunei DarussalamBulgariaBurkina FasoBurundiCabo VerdeCambodiaCameroonCanadaCaribbean small statesCayman IslandsCentral African RepublicCentral Europe and the BalticsChadChileChinaColombiaComorosCongo, Dem. Rep.Congo, Rep.Costa RicaCote d'IvoireCroatiaCubaCuracaoCyprusCzech RepublicDenmarkDjiboutiDominicaDominican RepublicEarly-demographic dividendEast Asia & PacificEast Asia & Pacific (excluding high income)East Asia & Pacific (IDA & IBRD countries)EcuadorEgypt, Arab Rep.El SalvadorEquatorial GuineaEritreaEstoniaEthiopiaEuro areaEurope & Central AsiaEurope & Central Asia (excluding high income)Europe & Central Asia (IDA & IBRD countries)European UnionFijiFinlandFragile and conflict affected situationsFranceGabonGambia, TheGeorgiaGermanyGhanaGibraltarGreeceGrenadaGuatemalaGuineaGuinea-BissauGuyanaHeavily indebted poor countries (HIPC)High incomeHondurasHong Kong SAR, ChinaHungaryIBRD onlyIcelandIDA & IBRD totalIDA blendIDA onlyIDA totalIndiaIndonesiaIran, Islamic Rep.IraqIrelandIsraelItalyJamaicaJapanJordanKazakhstanKenyaKiribatiKorea, Dem. People’s Rep.Korea, Rep.KuwaitKyrgyz RepublicLao PDRLate-demographic dividendLatin America & Caribbean Latin America & Caribbean (excluding high income)Latin America & the Caribbean (IDA & IBRD countries)LatviaLeast developed countries: UN classificationLebanonLesothoLiberiaLibyaLiechtensteinLithuaniaLow & middle incomeLow incomeLower middle incomeLuxembourgMacao SAR, ChinaMacedonia, FYRMadagascarMalawiMalaysiaMaldivesMaliMaltaMarshall IslandsMauritaniaMauritiusMexicoMicronesia, Fed. Sts.Middle East & North AfricaMiddle East & North Africa (excluding high income)Middle East & North Africa (IDA & IBRD countries)Middle incomeMoldovaMonacoMongoliaMontenegroMoroccoMozambiqueMyanmarNamibiaNauruNepalNetherlandsNew ZealandNicaraguaNigerNigeriaNorth AmericaNorwayOECD membersOmanOther small statesPacific island small statesPakistanPalauPanamaPapua New GuineaParaguayPeruPhilippinesPolandPortugalPost-demographic dividendPre-demographic dividendPuerto RicoQatarRomaniaRussian FederationRwandaSamoaSan MarinoSao Tome and PrincipeSaudi ArabiaSenegalSerbiaSeychellesSierra LeoneSingaporeSint Maarten (Dutch part)Slovak RepublicSloveniaSmall statesSolomon IslandsSomaliaSouth AfricaSouth AsiaSouth Asia (IDA & IBRD)SpainSri LankaSt. Kitts and NevisSt. LuciaSt. Vincent and the GrenadinesSub-Saharan Africa Sub-Saharan Africa (excluding high income)Sub-Saharan Africa (IDA & IBRD countries)SudanSurinameSwazilandSwedenSwitzerlandSyrian Arab RepublicTajikistanTanzaniaThailandTimor-LesteTogoTongaTrinidad and TobagoTunisiaTurkeyTurkmenistanTurks and Caicos IslandsTuvaluUgandaUkraineUnited Arab EmiratesUnited KingdomUnited StatesUpper middle incomeUruguayUzbekistanVanuatuVenezuela, RBVietnamWest Bank and GazaWorldYemen, Rep.ZambiaZimbabwe Timeline:
This timeline shows a graph from 1971 to 2015 of Seychelles. No data until 1970. Number of actual observations by date: 40.
Source name:
World Development Indicators
Source organization:
United Nations Educational, Scientific, and Cultural Organization (UNESCO) Institute for Statistics.
Categories, topics:
Education, Gender
Last updated:
apr 23, 2017
Indicators value changes by year
Minimum:
47.406
jan 1, 1988
Maximum:
56.247
jan 1, 1976
At the date of observation
Value
Absolute change
Change from previous value
jan 1, 1971
55.447
+55.447
0.0%
jan 1, 1972
55.492
+0.045
0.08%
jan 1, 1973
53.587
-1.905
-3.43%
jan 1, 1974
54.705
+1.117
2.08%
jan 1, 1975
53.415
-1.29
-2.36%
jan 1, 1976
56.247
+2.832
5.3%
jan 1, 1977
55.471
-0.776
-1.38%
jan 1, 1979
54.024
-1.446
-2.61%
jan 1, 1980
53.374
-0.651
-1.2%
jan 1, 1981
52.959
-0.415
-0.78%
jan 1, 1982
52.771
-0.187
-0.35%
jan 1, 1983
53.029
+0.258
0.49%
jan 1, 1984
51.209
-1.821
-3.43%
jan 1, 1986
49.325
-1.884
-3.68%
jan 1, 1987
48.426
-0.899
-1.82%
jan 1, 1988
47.406
-1.021
-2.11%
jan 1, 1989
47.756
+0.35
0.74%
jan 1, 1990
48.369
+0.613
1.28%
jan 1, 1992
48.836
+0.467
0.97%
jan 1, 1993
49.336
+0.5
1.02%
jan 1, 1994
49.72
+0.384
0.78%
jan 1, 1995
49.795
+0.075
0.15%
jan 1, 1996
48.998
-0.797
-1.6%
jan 1, 1997
49.423
+0.425
0.87%
jan 1, 1999
48.972
-0.451
-0.91%
jan 1, 2000
50.896
+1.924
3.93%
jan 1, 2001
51.316
+0.421
0.83%
jan 1, 2002
51.316
0.0
0.0%
jan 1, 2003
50.613
-0.703
-1.37%
jan 1, 2004
50.596
-0.017
-0.03%
jan 1, 2005
51.105
+0.509
1.01%
jan 1, 2006
50.3
-0.805
-1.58%
jan 1, 2008
50.407
+0.107
0.21%
jan 1, 2009
50.777
+0.37
0.73%
jan 1, 2010
50.326
-0.452
-0.89%
jan 1, 2011
49.444
-0.882
-1.75%
jan 1, 2012
49.702
+0.258
0.52%
jan 1, 2013
48.188
-1.515
-3.05%
jan 1, 2014
50.217
+2.029
4.21%
jan 1, 2015
49.242
-0.975
-1.94%
Ranking of countries by current statistics by years


Comments: