29
/
en
AIzaSyAYiBZKx7MnpbEhh9jyipgxe19OcubqV5w
April 1, 2024
51482
Middle income
MIC
false
2
1
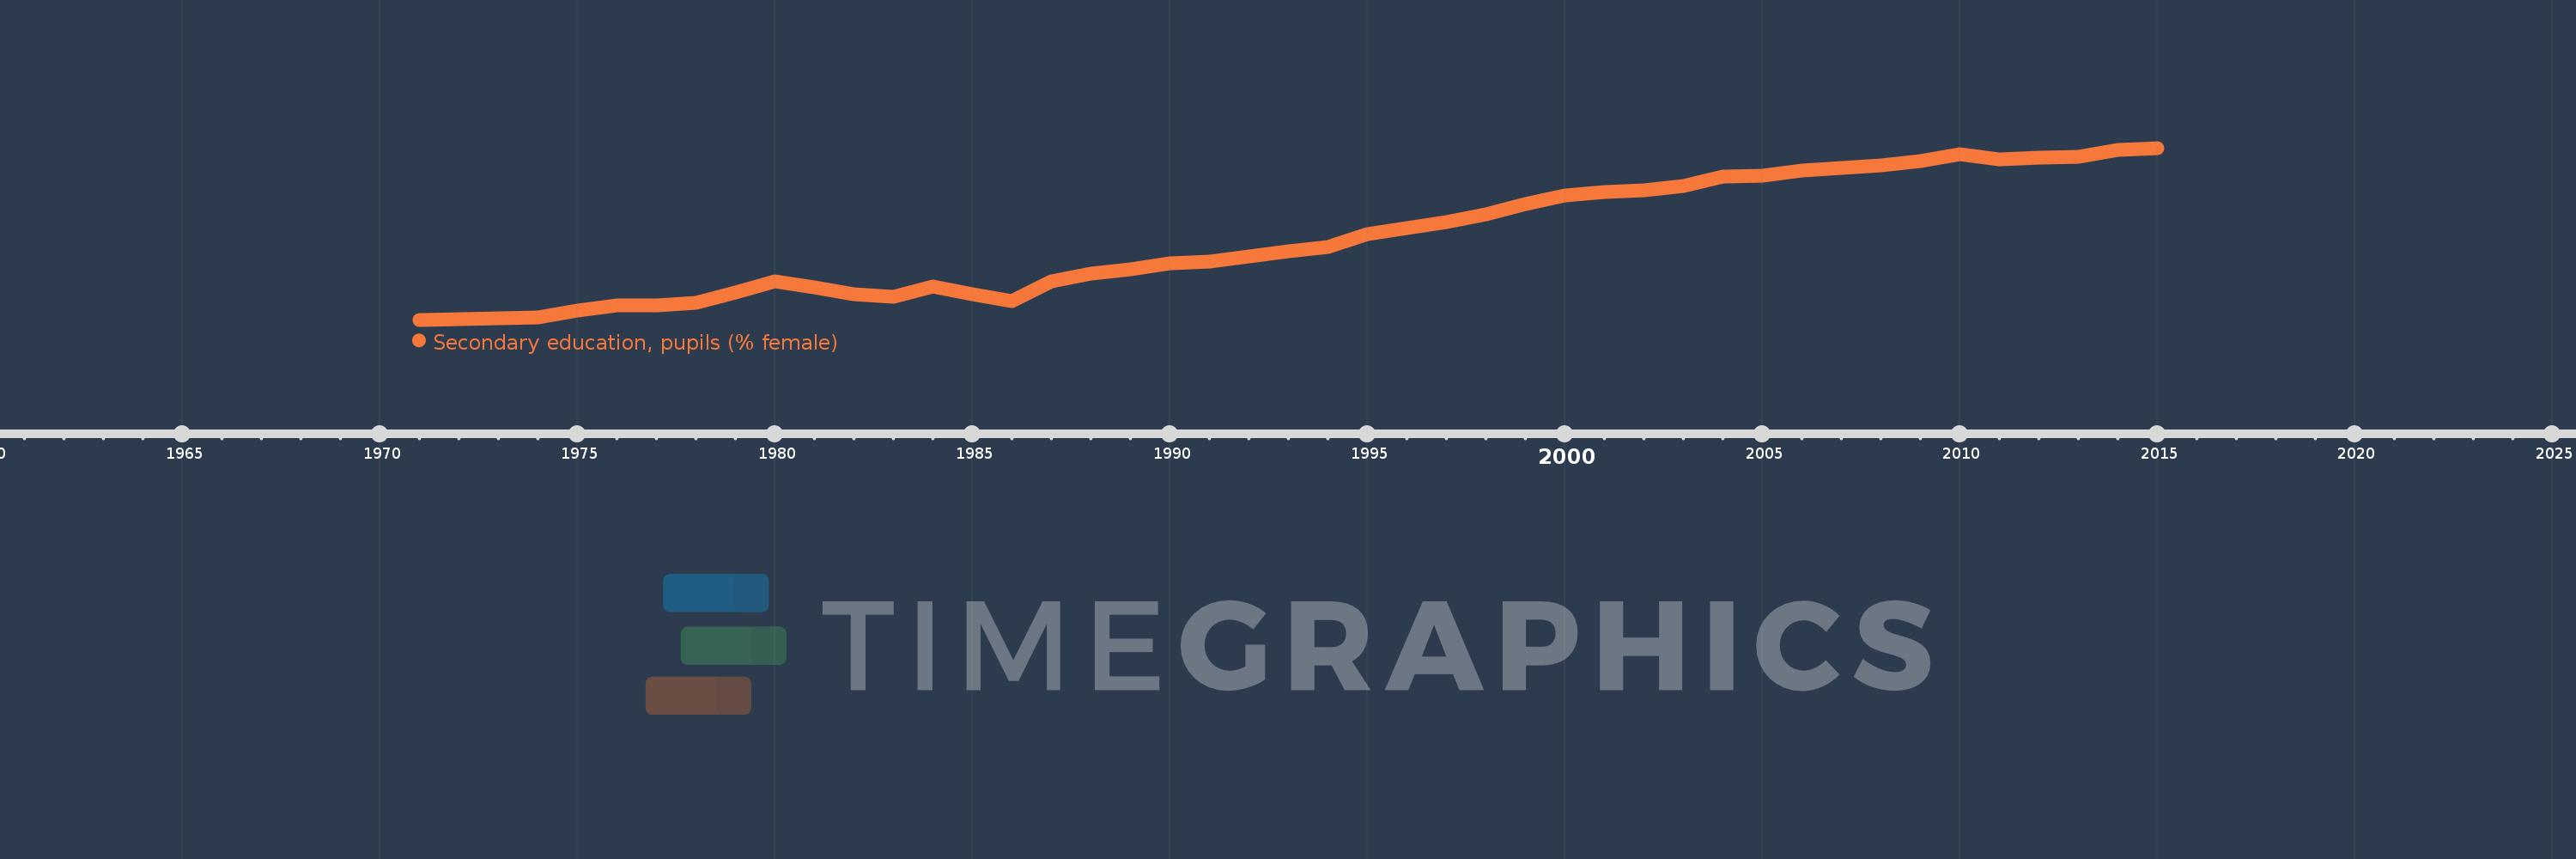
Secondary education, pupils (% female)
2015,2014,2013,2012,2011,2010,2009,2008,2007,2006,2005,2004,2003,2002,2001,2000,1999,1998,1997,1996,1995,1994,1993,1992,1991,1990,1989,1988,1987,1986,1985,1984,1983,1982,1981,1980,1979,1978,1977,1976,1975,1974,1973,1972,1971
This statistics in other country:
AfghanistanAlbaniaAlgeriaAndorraAngolaAntigua and BarbudaArab WorldArgentinaArmeniaArubaAustraliaAustriaAzerbaijanBahamas, TheBahrainBangladeshBarbadosBelarusBelgiumBelizeBeninBermudaBhutanBoliviaBosnia and HerzegovinaBotswanaBrazilBritish Virgin IslandsBrunei DarussalamBulgariaBurkina FasoBurundiCabo VerdeCambodiaCameroonCanadaCaribbean small statesCayman IslandsCentral African RepublicCentral Europe and the BalticsChadChileChinaColombiaComorosCongo, Dem. Rep.Congo, Rep.Costa RicaCote d'IvoireCroatiaCubaCuracaoCyprusCzech RepublicDenmarkDjiboutiDominicaDominican RepublicEarly-demographic dividendEast Asia & PacificEast Asia & Pacific (excluding high income)East Asia & Pacific (IDA & IBRD countries)EcuadorEgypt, Arab Rep.El SalvadorEquatorial GuineaEritreaEstoniaEthiopiaEuro areaEurope & Central AsiaEurope & Central Asia (excluding high income)Europe & Central Asia (IDA & IBRD countries)European UnionFijiFinlandFragile and conflict affected situationsFranceGabonGambia, TheGeorgiaGermanyGhanaGibraltarGreeceGrenadaGuatemalaGuineaGuinea-BissauGuyanaHeavily indebted poor countries (HIPC)High incomeHondurasHong Kong SAR, ChinaHungaryIBRD onlyIcelandIDA & IBRD totalIDA blendIDA onlyIDA totalIndiaIndonesiaIran, Islamic Rep.IraqIrelandIsraelItalyJamaicaJapanJordanKazakhstanKenyaKiribatiKorea, Dem. People’s Rep.Korea, Rep.KuwaitKyrgyz RepublicLao PDRLate-demographic dividendLatin America & Caribbean Latin America & Caribbean (excluding high income)Latin America & the Caribbean (IDA & IBRD countries)LatviaLeast developed countries: UN classificationLebanonLesothoLiberiaLibyaLiechtensteinLithuaniaLow & middle incomeLow incomeLower middle incomeLuxembourgMacao SAR, ChinaMacedonia, FYRMadagascarMalawiMalaysiaMaldivesMaliMaltaMarshall IslandsMauritaniaMauritiusMexicoMicronesia, Fed. Sts.Middle East & North AfricaMiddle East & North Africa (excluding high income)Middle East & North Africa (IDA & IBRD countries)Middle incomeMoldovaMonacoMongoliaMontenegroMoroccoMozambiqueMyanmarNamibiaNauruNepalNetherlandsNew ZealandNicaraguaNigerNigeriaNorth AmericaNorwayOECD membersOmanOther small statesPacific island small statesPakistanPalauPanamaPapua New GuineaParaguayPeruPhilippinesPolandPortugalPost-demographic dividendPre-demographic dividendPuerto RicoQatarRomaniaRussian FederationRwandaSamoaSan MarinoSao Tome and PrincipeSaudi ArabiaSenegalSerbiaSeychellesSierra LeoneSingaporeSint Maarten (Dutch part)Slovak RepublicSloveniaSmall statesSolomon IslandsSomaliaSouth AfricaSouth AsiaSouth Asia (IDA & IBRD)SpainSri LankaSt. Kitts and NevisSt. LuciaSt. Vincent and the GrenadinesSub-Saharan Africa Sub-Saharan Africa (excluding high income)Sub-Saharan Africa (IDA & IBRD countries)SudanSurinameSwazilandSwedenSwitzerlandSyrian Arab RepublicTajikistanTanzaniaThailandTimor-LesteTogoTongaTrinidad and TobagoTunisiaTurkeyTurkmenistanTurks and Caicos IslandsTuvaluUgandaUkraineUnited Arab EmiratesUnited KingdomUnited StatesUpper middle incomeUruguayUzbekistanVanuatuVenezuela, RBVietnamWest Bank and GazaWorldYemen, Rep.ZambiaZimbabwe Timeline:
This timeline shows a graph from 1971 to 2015 of Middle income. No data until 1970. Number of actual observations by date: 45.
Source name:
World Development Indicators
Source organization:
United Nations Educational, Scientific, and Cultural Organization (UNESCO) Institute for Statistics.
Categories, topics:
Education, Gender
Last updated:
apr 23, 2017
Indicators value changes by year
Minimum:
40.924
jan 1, 1971
Maximum:
48.089
jan 1, 2015
At the date of observation
Value
Absolute change
Change from previous value
jan 1, 1971
40.924
+40.924
0.0%
jan 1, 1972
40.94
+0.016
0.04%
jan 1, 1973
40.979
+0.039
0.1%
jan 1, 1974
41.038
+0.059
0.14%
jan 1, 1975
41.309
+0.27
0.66%
jan 1, 1976
41.537
+0.228
0.55%
jan 1, 1977
41.529
-0.008
-0.02%
jan 1, 1978
41.642
+0.113
0.27%
jan 1, 1979
42.076
+0.434
1.04%
jan 1, 1980
42.524
+0.448
1.06%
jan 1, 1981
42.276
-0.248
-0.58%
jan 1, 1982
41.983
-0.292
-0.69%
jan 1, 1983
41.867
-0.116
-0.28%
jan 1, 1984
42.298
+0.431
1.03%
jan 1, 1985
41.976
-0.322
-0.76%
jan 1, 1986
41.707
-0.27
-0.64%
jan 1, 1987
42.515
+0.809
1.94%
jan 1, 1988
42.865
+0.35
0.82%
jan 1, 1989
43.033
+0.168
0.39%
jan 1, 1990
43.269
+0.236
0.55%
jan 1, 1991
43.351
+0.083
0.19%
jan 1, 1992
43.553
+0.201
0.46%
jan 1, 1993
43.788
+0.236
0.54%
jan 1, 1994
43.964
+0.175
0.4%
jan 1, 1995
44.478
+0.514
1.17%
jan 1, 1996
44.738
+0.26
0.58%
jan 1, 1997
44.985
+0.248
0.55%
jan 1, 1998
45.307
+0.322
0.72%
jan 1, 1999
45.74
+0.432
0.95%
jan 1, 2000
46.122
+0.383
0.84%
jan 1, 2001
46.247
+0.125
0.27%
jan 1, 2002
46.333
+0.086
0.19%
jan 1, 2003
46.494
+0.161
0.35%
jan 1, 2004
46.909
+0.415
0.89%
jan 1, 2005
46.937
+0.027
0.06%
jan 1, 2006
47.138
+0.201
0.43%
jan 1, 2007
47.268
+0.13
0.28%
jan 1, 2008
47.379
+0.11
0.23%
jan 1, 2009
47.549
+0.171
0.36%
jan 1, 2010
47.831
+0.282
0.59%
jan 1, 2011
47.616
-0.215
-0.45%
jan 1, 2012
47.673
+0.057
0.12%
jan 1, 2013
47.703
+0.029
0.06%
jan 1, 2014
48.013
+0.31
0.65%
jan 1, 2015
48.089
+0.077
0.16%
Ranking of countries by current statistics by years


Comments: