29
/
en
AIzaSyAYiBZKx7MnpbEhh9jyipgxe19OcubqV5w
April 1, 2024
219044
Panama
PAN
true
2
1
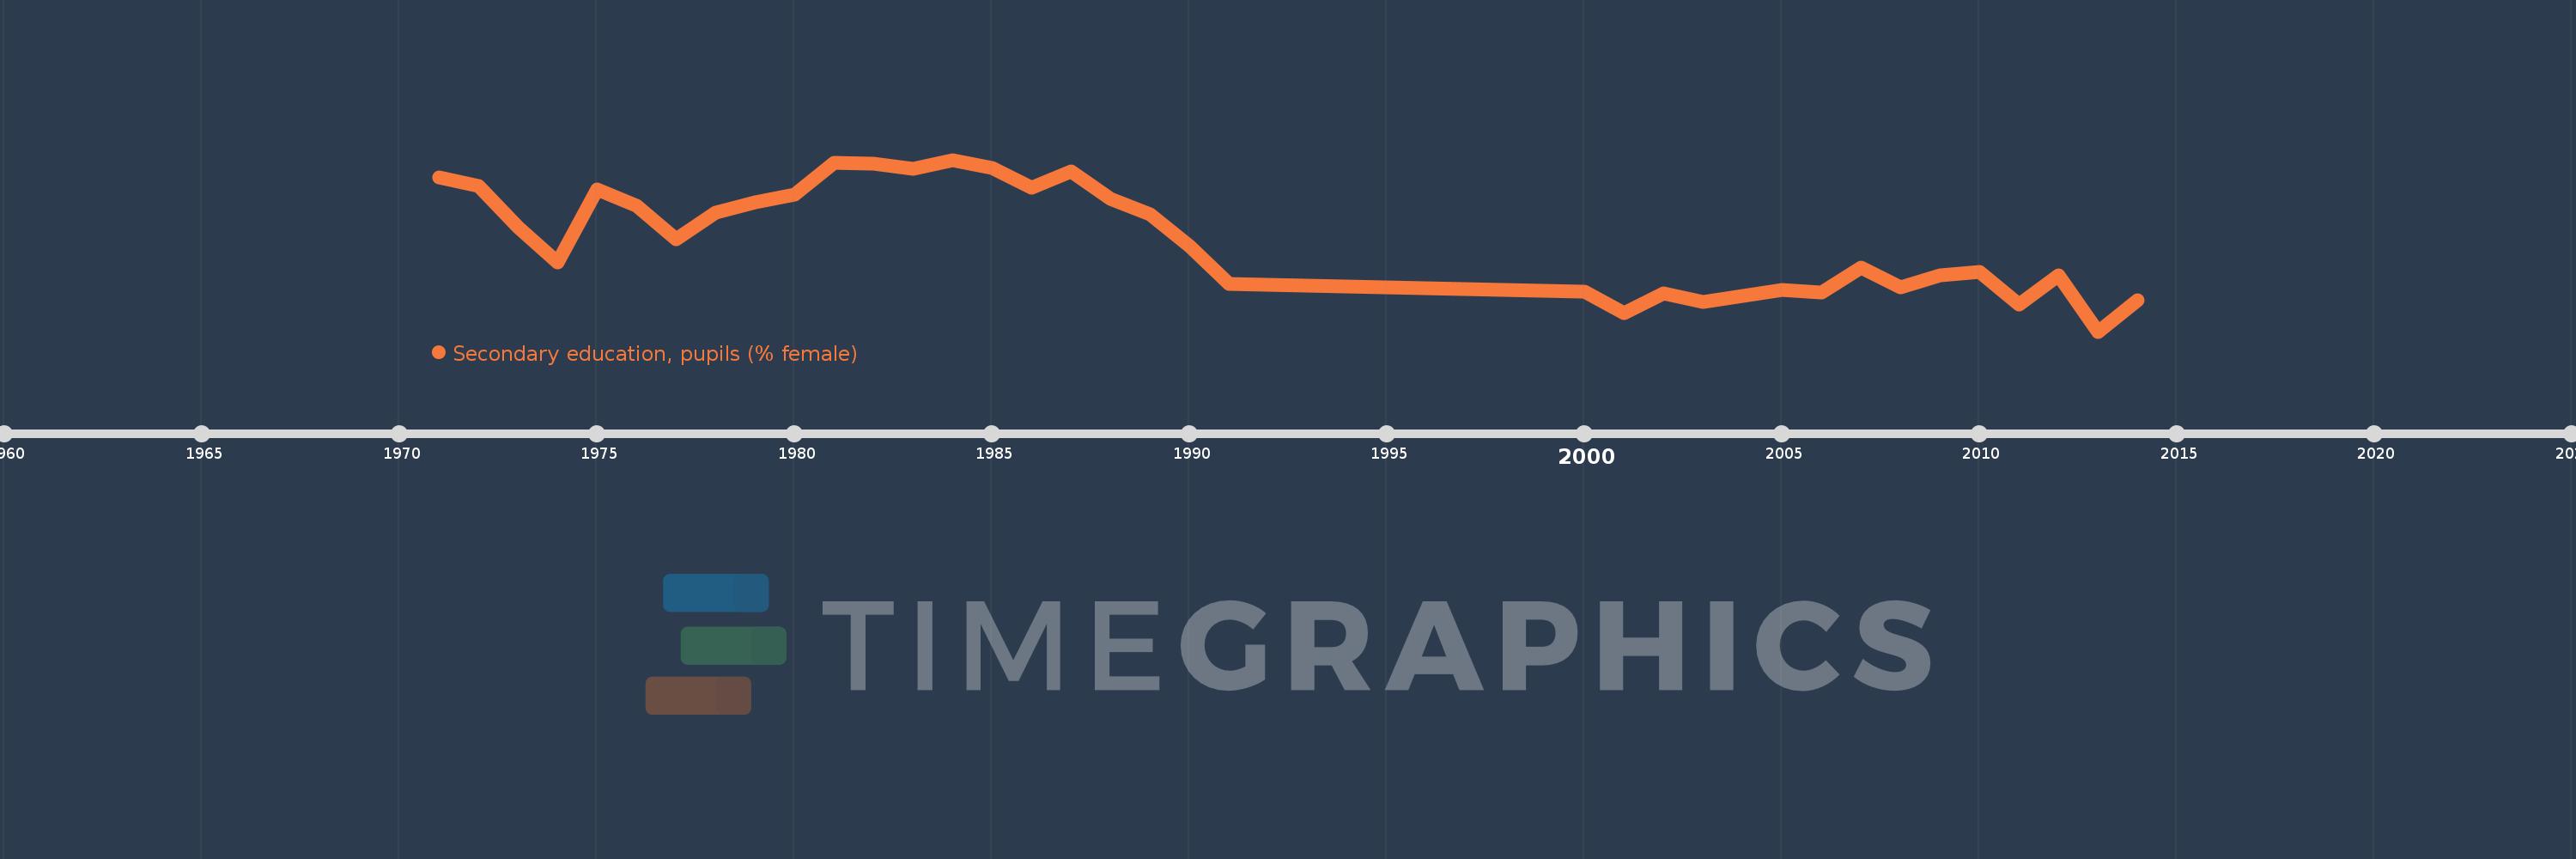
Secondary education, pupils (% female)
2014,2013,2012,2011,2010,2009,2008,2007,2006,2005,2003,2002,2001,2000,1991,1990,1989,1988,1987,1986,1985,1984,1983,1982,1981,1980,1979,1978,1977,1976,1975,1974,1973,1972,1971
This statistics in other country:
AfghanistanAlbaniaAlgeriaAndorraAngolaAntigua and BarbudaArab WorldArgentinaArmeniaArubaAustraliaAustriaAzerbaijanBahamas, TheBahrainBangladeshBarbadosBelarusBelgiumBelizeBeninBermudaBhutanBoliviaBosnia and HerzegovinaBotswanaBrazilBritish Virgin IslandsBrunei DarussalamBulgariaBurkina FasoBurundiCabo VerdeCambodiaCameroonCanadaCaribbean small statesCayman IslandsCentral African RepublicCentral Europe and the BalticsChadChileChinaColombiaComorosCongo, Dem. Rep.Congo, Rep.Costa RicaCote d'IvoireCroatiaCubaCuracaoCyprusCzech RepublicDenmarkDjiboutiDominicaDominican RepublicEarly-demographic dividendEast Asia & PacificEast Asia & Pacific (excluding high income)East Asia & Pacific (IDA & IBRD countries)EcuadorEgypt, Arab Rep.El SalvadorEquatorial GuineaEritreaEstoniaEthiopiaEuro areaEurope & Central AsiaEurope & Central Asia (excluding high income)Europe & Central Asia (IDA & IBRD countries)European UnionFijiFinlandFragile and conflict affected situationsFranceGabonGambia, TheGeorgiaGermanyGhanaGibraltarGreeceGrenadaGuatemalaGuineaGuinea-BissauGuyanaHeavily indebted poor countries (HIPC)High incomeHondurasHong Kong SAR, ChinaHungaryIBRD onlyIcelandIDA & IBRD totalIDA blendIDA onlyIDA totalIndiaIndonesiaIran, Islamic Rep.IraqIrelandIsraelItalyJamaicaJapanJordanKazakhstanKenyaKiribatiKorea, Dem. People’s Rep.Korea, Rep.KuwaitKyrgyz RepublicLao PDRLate-demographic dividendLatin America & Caribbean Latin America & Caribbean (excluding high income)Latin America & the Caribbean (IDA & IBRD countries)LatviaLeast developed countries: UN classificationLebanonLesothoLiberiaLibyaLiechtensteinLithuaniaLow & middle incomeLow incomeLower middle incomeLuxembourgMacao SAR, ChinaMacedonia, FYRMadagascarMalawiMalaysiaMaldivesMaliMaltaMarshall IslandsMauritaniaMauritiusMexicoMicronesia, Fed. Sts.Middle East & North AfricaMiddle East & North Africa (excluding high income)Middle East & North Africa (IDA & IBRD countries)Middle incomeMoldovaMonacoMongoliaMontenegroMoroccoMozambiqueMyanmarNamibiaNauruNepalNetherlandsNew ZealandNicaraguaNigerNigeriaNorth AmericaNorwayOECD membersOmanOther small statesPacific island small statesPakistanPalauPanamaPapua New GuineaParaguayPeruPhilippinesPolandPortugalPost-demographic dividendPre-demographic dividendPuerto RicoQatarRomaniaRussian FederationRwandaSamoaSan MarinoSao Tome and PrincipeSaudi ArabiaSenegalSerbiaSeychellesSierra LeoneSingaporeSint Maarten (Dutch part)Slovak RepublicSloveniaSmall statesSolomon IslandsSomaliaSouth AfricaSouth AsiaSouth Asia (IDA & IBRD)SpainSri LankaSt. Kitts and NevisSt. LuciaSt. Vincent and the GrenadinesSub-Saharan Africa Sub-Saharan Africa (excluding high income)Sub-Saharan Africa (IDA & IBRD countries)SudanSurinameSwazilandSwedenSwitzerlandSyrian Arab RepublicTajikistanTanzaniaThailandTimor-LesteTogoTongaTrinidad and TobagoTunisiaTurkeyTurkmenistanTurks and Caicos IslandsTuvaluUgandaUkraineUnited Arab EmiratesUnited KingdomUnited StatesUpper middle incomeUruguayUzbekistanVanuatuVenezuela, RBVietnamWest Bank and GazaWorldYemen, Rep.ZambiaZimbabwe Timeline:
This timeline shows a graph from 1971 to 2014 of Panama. No data until 1970. Number of actual observations by date: 35.
Source name:
World Development Indicators
Source organization:
United Nations Educational, Scientific, and Cultural Organization (UNESCO) Institute for Statistics.
Categories, topics:
Education, Gender
Last updated:
apr 23, 2017
Indicators value changes by year
Minimum:
50.347
jan 1, 2013
Maximum:
52.186
jan 1, 1984
At the date of observation
Value
Absolute change
Change from previous value
jan 1, 1971
51.996
+51.996
0.0%
jan 1, 1972
51.907
-0.088
-0.17%
jan 1, 1973
51.466
-0.441
-0.85%
jan 1, 1974
51.083
-0.383
-0.74%
jan 1, 1975
51.871
+0.788
1.54%
jan 1, 1976
51.695
-0.176
-0.34%
jan 1, 1977
51.34
-0.356
-0.69%
jan 1, 1978
51.619
+0.28
0.54%
jan 1, 1979
51.732
+0.112
0.22%
jan 1, 1980
51.816
+0.084
0.16%
jan 1, 1981
52.155
+0.339
0.66%
jan 1, 1982
52.146
-0.009
-0.02%
jan 1, 1983
52.091
-0.055
-0.11%
jan 1, 1984
52.186
+0.095
0.18%
jan 1, 1985
52.095
-0.09
-0.17%
jan 1, 1986
51.887
-0.209
-0.4%
jan 1, 1987
52.06
+0.173
0.33%
jan 1, 1988
51.764
-0.295
-0.57%
jan 1, 1989
51.601
-0.164
-0.32%
jan 1, 1990
51.261
-0.34
-0.66%
jan 1, 1991
50.859
-0.402
-0.78%
jan 1, 2000
50.779
-0.08
-0.16%
jan 1, 2001
50.547
-0.232
-0.46%
jan 1, 2002
50.752
+0.205
0.4%
jan 1, 2003
50.668
-0.083
-0.16%
jan 1, 2005
50.795
+0.126
0.25%
jan 1, 2006
50.763
-0.032
-0.06%
jan 1, 2007
51.036
+0.273
0.54%
jan 1, 2008
50.819
-0.217
-0.42%
jan 1, 2009
50.95
+0.131
0.26%
jan 1, 2010
50.985
+0.035
0.07%
jan 1, 2011
50.638
-0.348
-0.68%
jan 1, 2012
50.949
+0.311
0.62%
jan 1, 2013
50.347
-0.602
-1.18%
jan 1, 2014
50.684
+0.337
0.67%
Ranking of countries by current statistics by years


Comments: