29
/
en
AIzaSyAYiBZKx7MnpbEhh9jyipgxe19OcubqV5w
April 1, 2024
152013
Hong Kong SAR, China
HKG
true
2
1
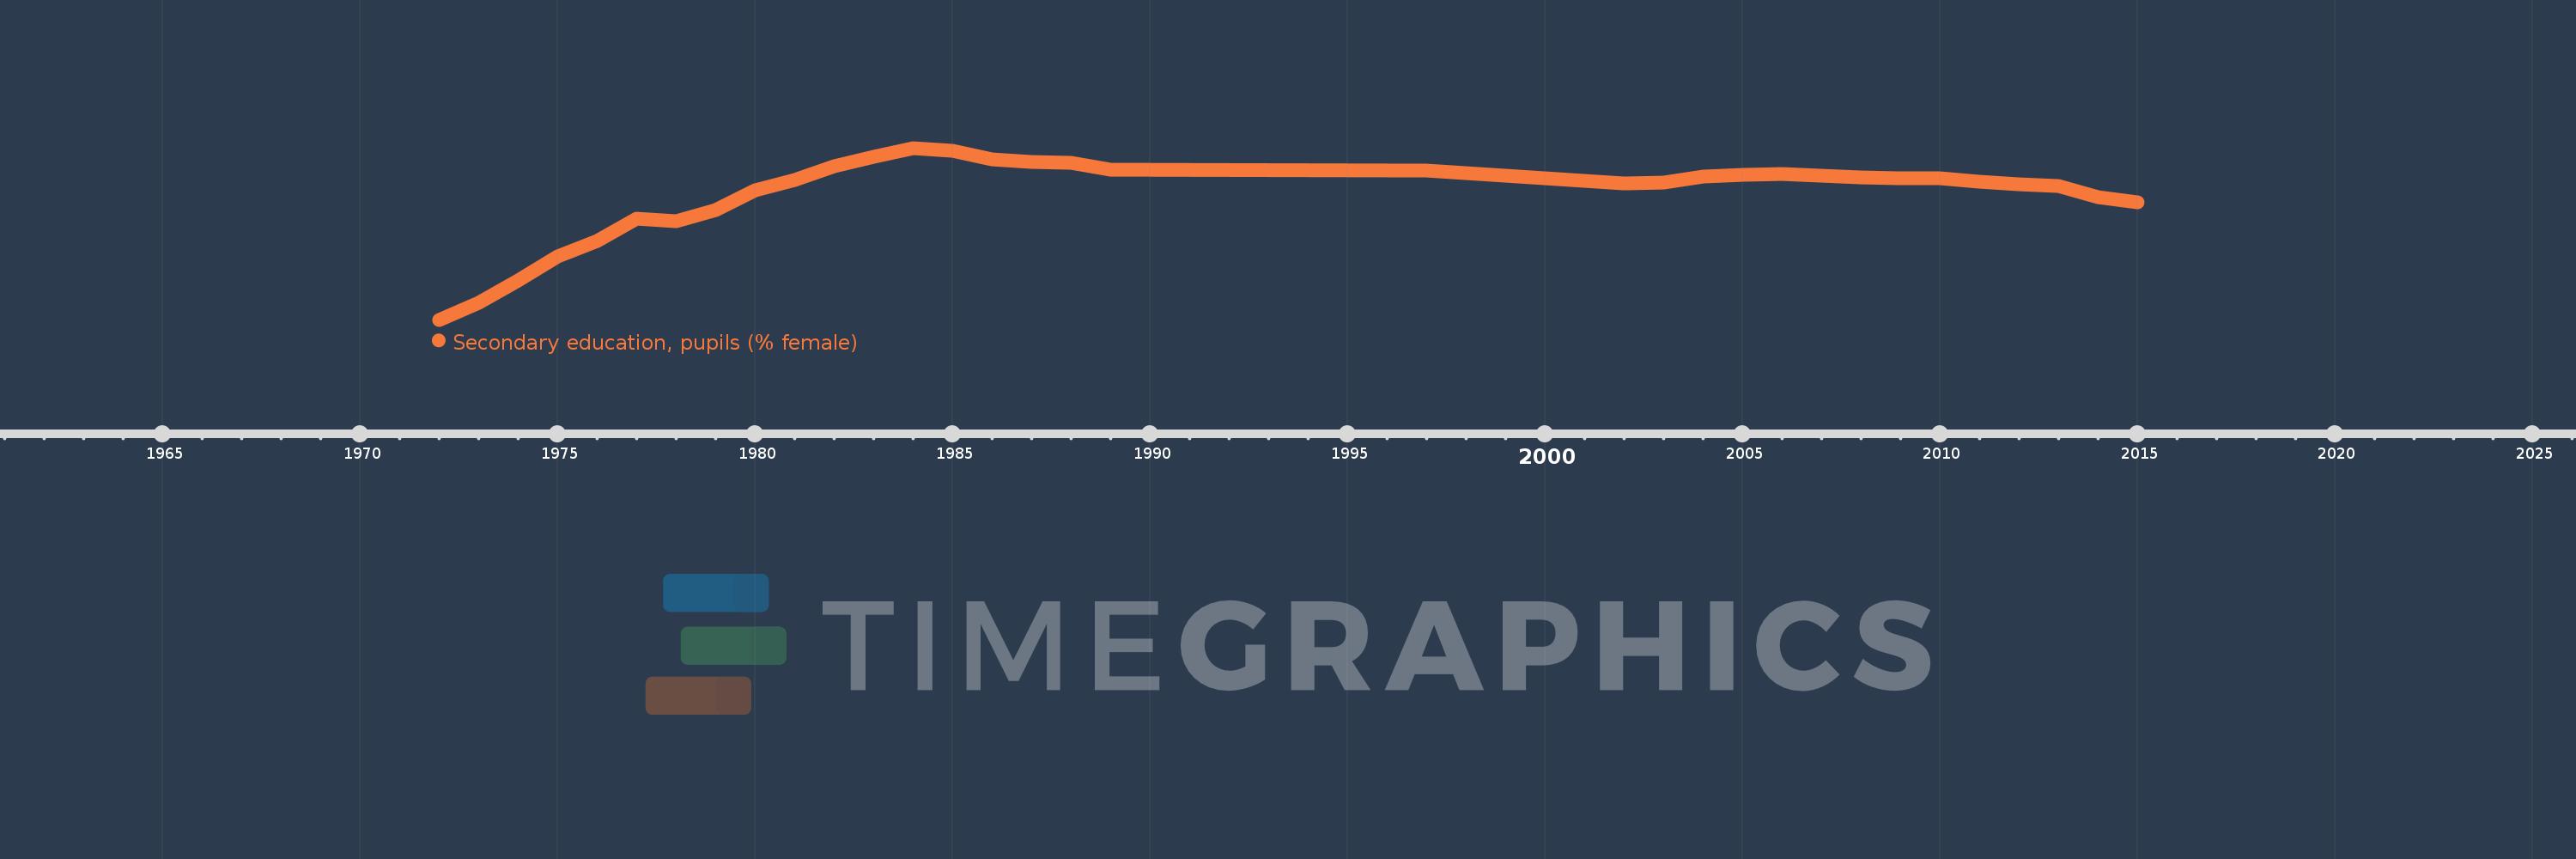
Secondary education, pupils (% female)
2015,2014,2013,2012,2011,2010,2009,2008,2007,2006,2005,2004,2003,2002,1997,1989,1988,1987,1986,1985,1984,1983,1982,1981,1980,1979,1978,1977,1976,1975,1974,1973,1972
This statistics in other country:
AfghanistanAlbaniaAlgeriaAndorraAngolaAntigua and BarbudaArab WorldArgentinaArmeniaArubaAustraliaAustriaAzerbaijanBahamas, TheBahrainBangladeshBarbadosBelarusBelgiumBelizeBeninBermudaBhutanBoliviaBosnia and HerzegovinaBotswanaBrazilBritish Virgin IslandsBrunei DarussalamBulgariaBurkina FasoBurundiCabo VerdeCambodiaCameroonCanadaCaribbean small statesCayman IslandsCentral African RepublicCentral Europe and the BalticsChadChileChinaColombiaComorosCongo, Dem. Rep.Congo, Rep.Costa RicaCote d'IvoireCroatiaCubaCuracaoCyprusCzech RepublicDenmarkDjiboutiDominicaDominican RepublicEarly-demographic dividendEast Asia & PacificEast Asia & Pacific (excluding high income)East Asia & Pacific (IDA & IBRD countries)EcuadorEgypt, Arab Rep.El SalvadorEquatorial GuineaEritreaEstoniaEthiopiaEuro areaEurope & Central AsiaEurope & Central Asia (excluding high income)Europe & Central Asia (IDA & IBRD countries)European UnionFijiFinlandFragile and conflict affected situationsFranceGabonGambia, TheGeorgiaGermanyGhanaGibraltarGreeceGrenadaGuatemalaGuineaGuinea-BissauGuyanaHeavily indebted poor countries (HIPC)High incomeHondurasHong Kong SAR, ChinaHungaryIBRD onlyIcelandIDA & IBRD totalIDA blendIDA onlyIDA totalIndiaIndonesiaIran, Islamic Rep.IraqIrelandIsraelItalyJamaicaJapanJordanKazakhstanKenyaKiribatiKorea, Dem. People’s Rep.Korea, Rep.KuwaitKyrgyz RepublicLao PDRLate-demographic dividendLatin America & Caribbean Latin America & Caribbean (excluding high income)Latin America & the Caribbean (IDA & IBRD countries)LatviaLeast developed countries: UN classificationLebanonLesothoLiberiaLibyaLiechtensteinLithuaniaLow & middle incomeLow incomeLower middle incomeLuxembourgMacao SAR, ChinaMacedonia, FYRMadagascarMalawiMalaysiaMaldivesMaliMaltaMarshall IslandsMauritaniaMauritiusMexicoMicronesia, Fed. Sts.Middle East & North AfricaMiddle East & North Africa (excluding high income)Middle East & North Africa (IDA & IBRD countries)Middle incomeMoldovaMonacoMongoliaMontenegroMoroccoMozambiqueMyanmarNamibiaNauruNepalNetherlandsNew ZealandNicaraguaNigerNigeriaNorth AmericaNorwayOECD membersOmanOther small statesPacific island small statesPakistanPalauPanamaPapua New GuineaParaguayPeruPhilippinesPolandPortugalPost-demographic dividendPre-demographic dividendPuerto RicoQatarRomaniaRussian FederationRwandaSamoaSan MarinoSao Tome and PrincipeSaudi ArabiaSenegalSerbiaSeychellesSierra LeoneSingaporeSint Maarten (Dutch part)Slovak RepublicSloveniaSmall statesSolomon IslandsSomaliaSouth AfricaSouth AsiaSouth Asia (IDA & IBRD)SpainSri LankaSt. Kitts and NevisSt. LuciaSt. Vincent and the GrenadinesSub-Saharan Africa Sub-Saharan Africa (excluding high income)Sub-Saharan Africa (IDA & IBRD countries)SudanSurinameSwazilandSwedenSwitzerlandSyrian Arab RepublicTajikistanTanzaniaThailandTimor-LesteTogoTongaTrinidad and TobagoTunisiaTurkeyTurkmenistanTurks and Caicos IslandsTuvaluUgandaUkraineUnited Arab EmiratesUnited KingdomUnited StatesUpper middle incomeUruguayUzbekistanVanuatuVenezuela, RBVietnamWest Bank and GazaWorldYemen, Rep.ZambiaZimbabwe Timeline:
This timeline shows a graph from 1972 to 2015 of Hong Kong SAR, China. No data until 1971. Number of actual observations by date: 33.
Source name:
World Development Indicators
Source organization:
United Nations Educational, Scientific, and Cultural Organization (UNESCO) Institute for Statistics.
Categories, topics:
Education, Gender
Last updated:
apr 23, 2017
Indicators value changes by year
Minimum:
41.831
jan 1, 1972
Maximum:
50.189
jan 1, 1984
At the date of observation
Value
Absolute change
Change from previous value
jan 1, 1972
41.831
+41.831
0.0%
jan 1, 1973
42.636
+0.805
1.93%
jan 1, 1974
43.748
+1.112
2.61%
jan 1, 1975
44.896
+1.148
2.62%
jan 1, 1976
45.669
+0.773
1.72%
jan 1, 1977
46.766
+1.097
2.4%
jan 1, 1978
46.614
-0.152
-0.32%
jan 1, 1979
47.166
+0.552
1.18%
jan 1, 1980
48.124
+0.958
2.03%
jan 1, 1981
48.64
+0.516
1.07%
jan 1, 1982
49.307
+0.667
1.37%
jan 1, 1983
49.779
+0.472
0.96%
jan 1, 1984
50.189
+0.41
0.82%
jan 1, 1985
50.065
-0.124
-0.25%
jan 1, 1986
49.632
-0.433
-0.87%
jan 1, 1987
49.505
-0.127
-0.26%
jan 1, 1988
49.486
-0.019
-0.04%
jan 1, 1989
49.134
-0.352
-0.71%
jan 1, 1997
49.071
-0.063
-0.13%
jan 1, 2002
48.463
-0.607
-1.24%
jan 1, 2003
48.515
+0.052
0.11%
jan 1, 2004
48.798
+0.284
0.58%
jan 1, 2005
48.897
+0.099
0.2%
jan 1, 2006
48.936
+0.039
0.08%
jan 1, 2007
48.824
-0.111
-0.23%
jan 1, 2008
48.769
-0.056
-0.11%
jan 1, 2009
48.718
-0.051
-0.1%
jan 1, 2010
48.705
-0.013
-0.03%
jan 1, 2011
48.527
-0.178
-0.37%
jan 1, 2012
48.418
-0.11
-0.23%
jan 1, 2013
48.347
-0.071
-0.15%
jan 1, 2014
47.791
-0.556
-1.15%
jan 1, 2015
47.53
-0.261
-0.55%
Ranking of countries by current statistics by years


Comments: