29
/
en
AIzaSyAYiBZKx7MnpbEhh9jyipgxe19OcubqV5w
April 1, 2024
54820
Post-demographic dividend
PST
false
2
1
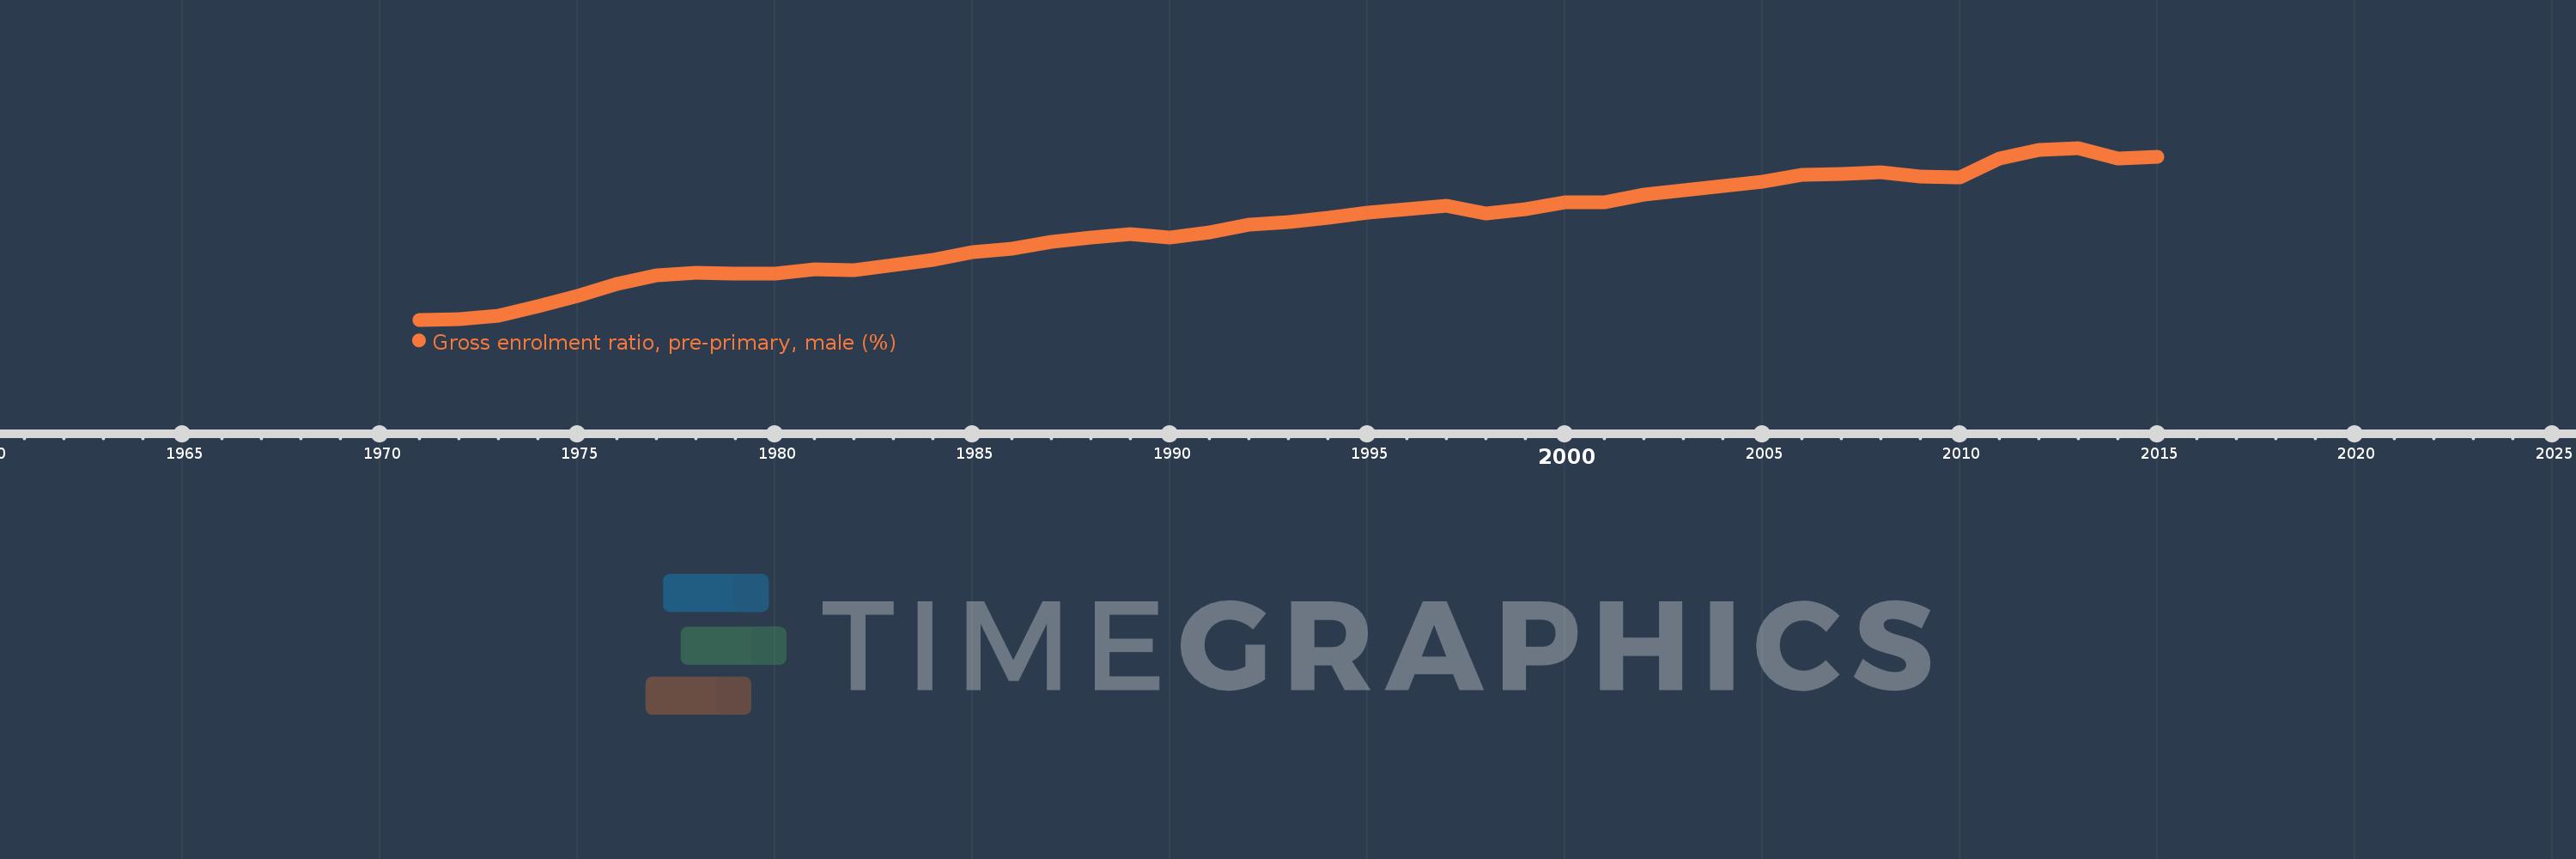
Gross enrolment ratio, pre-primary, male (%)
2015,2014,2013,2012,2011,2010,2009,2008,2007,2006,2005,2004,2003,2002,2001,2000,1999,1998,1997,1996,1995,1994,1993,1992,1991,1990,1989,1988,1987,1986,1985,1984,1983,1982,1981,1980,1979,1978,1977,1976,1975,1974,1973,1972,1971
This statistics in other country:
AfghanistanAlbaniaAlgeriaAndorraAngolaAntigua and BarbudaArab WorldArgentinaArmeniaArubaAustraliaAustriaAzerbaijanBahamas, TheBahrainBangladeshBarbadosBelarusBelgiumBelizeBeninBermudaBhutanBoliviaBosnia and HerzegovinaBotswanaBrazilBrunei DarussalamBulgariaBurkina FasoBurundiCabo VerdeCambodiaCameroonCanadaCaribbean small statesCentral African RepublicCentral Europe and the BalticsChadChileChinaColombiaComorosCongo, Dem. Rep.Congo, Rep.Costa RicaCote d'IvoireCroatiaCubaCyprusCzech RepublicDenmarkDjiboutiDominicaDominican RepublicEarly-demographic dividendEast Asia & PacificEast Asia & Pacific (excluding high income)East Asia & Pacific (IDA & IBRD countries)EcuadorEgypt, Arab Rep.El SalvadorEquatorial GuineaEritreaEstoniaEthiopiaEuro areaEurope & Central AsiaEurope & Central Asia (excluding high income)Europe & Central Asia (IDA & IBRD countries)European UnionFijiFinlandFragile and conflict affected situationsFranceGabonGambia, TheGeorgiaGermanyGhanaGreeceGrenadaGuatemalaGuineaGuinea-BissauGuyanaHeavily indebted poor countries (HIPC)High incomeHondurasHong Kong SAR, ChinaHungaryIBRD onlyIcelandIDA & IBRD totalIDA blendIDA onlyIDA totalIndiaIndonesiaIran, Islamic Rep.IraqIrelandIsraelItalyJamaicaJapanJordanKazakhstanKenyaKorea, Dem. People’s Rep.Korea, Rep.KuwaitKyrgyz RepublicLao PDRLate-demographic dividendLatin America & Caribbean Latin America & Caribbean (excluding high income)Latin America & the Caribbean (IDA & IBRD countries)LatviaLeast developed countries: UN classificationLebanonLesothoLiberiaLibyaLiechtensteinLithuaniaLow & middle incomeLow incomeLower middle incomeLuxembourgMacao SAR, ChinaMacedonia, FYRMadagascarMaldivesMaliMaltaMarshall IslandsMauritaniaMauritiusMexicoMicronesia, Fed. Sts.Middle East & North AfricaMiddle East & North Africa (excluding high income)Middle East & North Africa (IDA & IBRD countries)Middle incomeMoldovaMongoliaMontenegroMoroccoMozambiqueMyanmarNamibiaNauruNepalNetherlandsNew ZealandNicaraguaNigerNigeriaNorth AmericaNorwayOECD membersOmanOther small statesPacific island small statesPakistanPalauPanamaPapua New GuineaParaguayPeruPhilippinesPolandPortugalPost-demographic dividendPre-demographic dividendPuerto RicoQatarRomaniaRussian FederationRwandaSamoaSan MarinoSao Tome and PrincipeSaudi ArabiaSenegalSerbiaSeychellesSierra LeoneSlovak RepublicSloveniaSmall statesSolomon IslandsSomaliaSouth AfricaSouth AsiaSouth Asia (IDA & IBRD)South SudanSpainSri LankaSt. Kitts and NevisSt. LuciaSt. Vincent and the GrenadinesSub-Saharan Africa Sub-Saharan Africa (excluding high income)Sub-Saharan Africa (IDA & IBRD countries)SudanSurinameSwazilandSwedenSwitzerlandSyrian Arab RepublicTajikistanTanzaniaThailandTimor-LesteTogoTongaTrinidad and TobagoTunisiaTurkeyTurkmenistanTuvaluUgandaUkraineUnited Arab EmiratesUnited KingdomUnited StatesUpper middle incomeUruguayUzbekistanVanuatuVenezuela, RBVietnamWest Bank and GazaWorldYemen, Rep.Zimbabwe Timeline:
This timeline shows a graph from 1971 to 2015 of Post-demographic dividend. No data until 1970. Number of actual observations by date: 45.
Source name:
World Development Indicators
Source organization:
UNESCO Institute for Statistics
Categories, topics:
Education, Gender
Last updated:
apr 23, 2017
Indicators value changes by year
Minimum:
47.252
jan 1, 1971
Maximum:
89.313
jan 1, 2013
At the date of observation
Value
Absolute change
Change from previous value
jan 1, 1971
47.252
+47.252
0.0%
jan 1, 1972
47.436
+0.184
0.39%
jan 1, 1973
48.193
+0.757
1.6%
jan 1, 1974
50.515
+2.322
4.82%
jan 1, 1975
52.985
+2.47
4.89%
jan 1, 1976
56.077
+3.093
5.84%
jan 1, 1977
58.228
+2.15
3.83%
jan 1, 1978
58.667
+0.439
0.75%
jan 1, 1979
58.638
-0.028
-0.05%
jan 1, 1980
58.602
-0.037
-0.06%
jan 1, 1981
59.548
+0.946
1.61%
jan 1, 1982
59.483
-0.065
-0.11%
jan 1, 1983
60.566
+1.082
1.82%
jan 1, 1984
61.847
+1.281
2.11%
jan 1, 1985
63.77
+1.923
3.11%
jan 1, 1986
64.634
+0.864
1.35%
jan 1, 1987
66.318
+1.685
2.61%
jan 1, 1988
67.4
+1.082
1.63%
jan 1, 1989
68.142
+0.742
1.1%
jan 1, 1990
67.373
-0.769
-1.13%
jan 1, 1991
68.71
+1.337
1.98%
jan 1, 1992
70.527
+1.817
2.64%
jan 1, 1993
71.151
+0.624
0.88%
jan 1, 1994
72.213
+1.062
1.49%
jan 1, 1995
73.447
+1.234
1.71%
jan 1, 1996
74.282
+0.835
1.14%
jan 1, 1997
75.228
+0.946
1.27%
jan 1, 1998
73.221
-2.008
-2.67%
jan 1, 1999
74.411
+1.19
1.63%
jan 1, 2000
75.926
+1.515
2.04%
jan 1, 2001
75.941
+0.015
0.02%
jan 1, 2002
77.991
+2.05
2.7%
jan 1, 2003
79.01
+1.019
1.31%
jan 1, 2004
80.037
+1.028
1.3%
jan 1, 2005
81.027
+0.99
1.24%
jan 1, 2006
82.759
+1.732
2.14%
jan 1, 2007
82.972
+0.213
0.26%
jan 1, 2008
83.443
+0.472
0.57%
jan 1, 2009
82.306
-1.138
-1.36%
jan 1, 2010
82.04
-0.265
-0.32%
jan 1, 2011
86.703
+4.663
5.68%
jan 1, 2012
88.731
+2.028
2.34%
jan 1, 2013
89.313
+0.582
0.66%
jan 1, 2014
86.653
-2.66
-2.98%
jan 1, 2015
87.182
+0.53
0.61%
Ranking of countries by current statistics by years


Comments: