29
/
en
AIzaSyAYiBZKx7MnpbEhh9jyipgxe19OcubqV5w
April 1, 2024
164895
Jordan
JOR
true
2
1
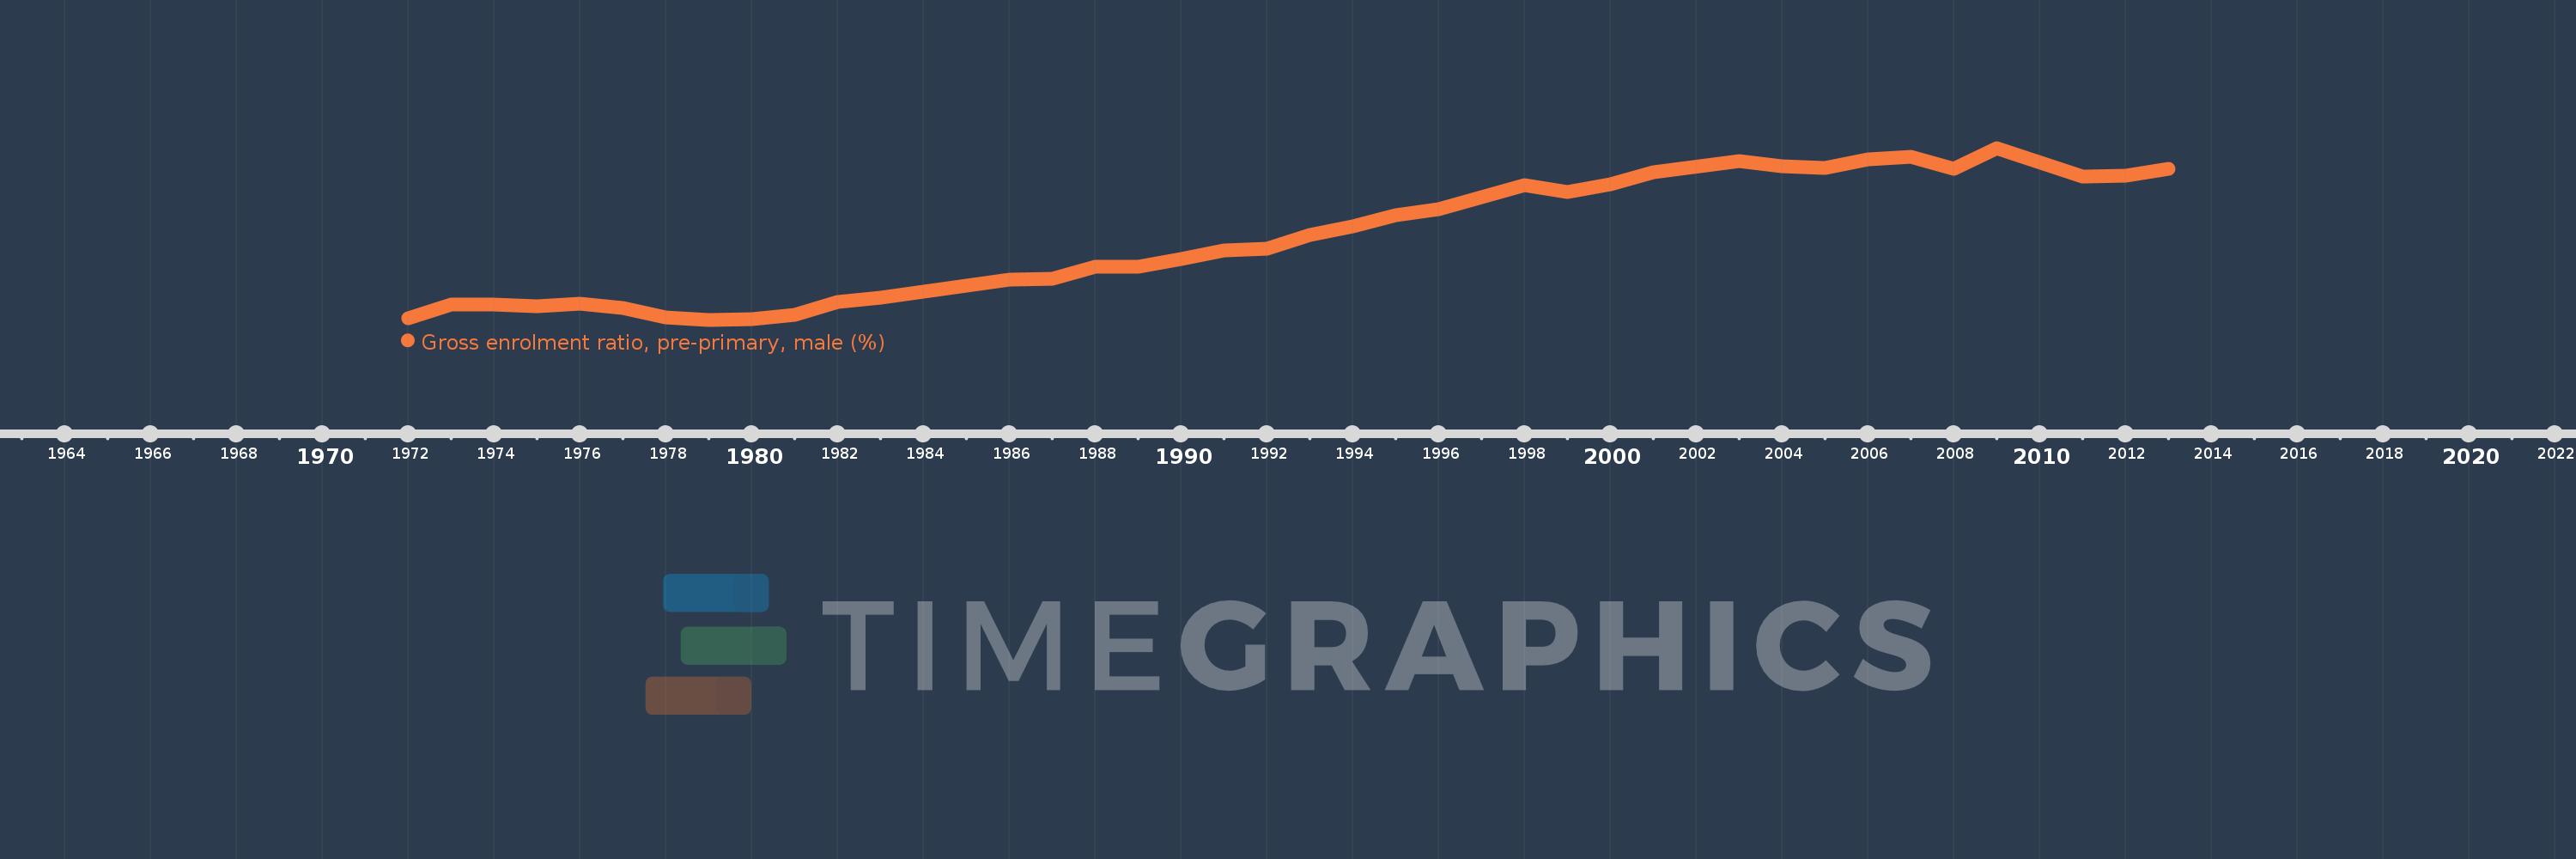
Gross enrolment ratio, pre-primary, male (%)
2013,2012,2011,2009,2008,2007,2006,2005,2004,2003,2001,2000,1999,1998,1997,1996,1995,1994,1993,1992,1991,1990,1989,1988,1987,1986,1985,1984,1983,1982,1981,1980,1979,1978,1977,1976,1975,1974,1973,1972
This statistics in other country:
AfghanistanAlbaniaAlgeriaAndorraAngolaAntigua and BarbudaArab WorldArgentinaArmeniaArubaAustraliaAustriaAzerbaijanBahamas, TheBahrainBangladeshBarbadosBelarusBelgiumBelizeBeninBermudaBhutanBoliviaBosnia and HerzegovinaBotswanaBrazilBrunei DarussalamBulgariaBurkina FasoBurundiCabo VerdeCambodiaCameroonCanadaCaribbean small statesCentral African RepublicCentral Europe and the BalticsChadChileChinaColombiaComorosCongo, Dem. Rep.Congo, Rep.Costa RicaCote d'IvoireCroatiaCubaCyprusCzech RepublicDenmarkDjiboutiDominicaDominican RepublicEarly-demographic dividendEast Asia & PacificEast Asia & Pacific (excluding high income)East Asia & Pacific (IDA & IBRD countries)EcuadorEgypt, Arab Rep.El SalvadorEquatorial GuineaEritreaEstoniaEthiopiaEuro areaEurope & Central AsiaEurope & Central Asia (excluding high income)Europe & Central Asia (IDA & IBRD countries)European UnionFijiFinlandFragile and conflict affected situationsFranceGabonGambia, TheGeorgiaGermanyGhanaGreeceGrenadaGuatemalaGuineaGuinea-BissauGuyanaHeavily indebted poor countries (HIPC)High incomeHondurasHong Kong SAR, ChinaHungaryIBRD onlyIcelandIDA & IBRD totalIDA blendIDA onlyIDA totalIndiaIndonesiaIran, Islamic Rep.IraqIrelandIsraelItalyJamaicaJapanJordanKazakhstanKenyaKorea, Dem. People’s Rep.Korea, Rep.KuwaitKyrgyz RepublicLao PDRLate-demographic dividendLatin America & Caribbean Latin America & Caribbean (excluding high income)Latin America & the Caribbean (IDA & IBRD countries)LatviaLeast developed countries: UN classificationLebanonLesothoLiberiaLibyaLiechtensteinLithuaniaLow & middle incomeLow incomeLower middle incomeLuxembourgMacao SAR, ChinaMacedonia, FYRMadagascarMaldivesMaliMaltaMarshall IslandsMauritaniaMauritiusMexicoMicronesia, Fed. Sts.Middle East & North AfricaMiddle East & North Africa (excluding high income)Middle East & North Africa (IDA & IBRD countries)Middle incomeMoldovaMongoliaMontenegroMoroccoMozambiqueMyanmarNamibiaNauruNepalNetherlandsNew ZealandNicaraguaNigerNigeriaNorth AmericaNorwayOECD membersOmanOther small statesPacific island small statesPakistanPalauPanamaPapua New GuineaParaguayPeruPhilippinesPolandPortugalPost-demographic dividendPre-demographic dividendPuerto RicoQatarRomaniaRussian FederationRwandaSamoaSan MarinoSao Tome and PrincipeSaudi ArabiaSenegalSerbiaSeychellesSierra LeoneSlovak RepublicSloveniaSmall statesSolomon IslandsSomaliaSouth AfricaSouth AsiaSouth Asia (IDA & IBRD)South SudanSpainSri LankaSt. Kitts and NevisSt. LuciaSt. Vincent and the GrenadinesSub-Saharan Africa Sub-Saharan Africa (excluding high income)Sub-Saharan Africa (IDA & IBRD countries)SudanSurinameSwazilandSwedenSwitzerlandSyrian Arab RepublicTajikistanTanzaniaThailandTimor-LesteTogoTongaTrinidad and TobagoTunisiaTurkeyTurkmenistanTuvaluUgandaUkraineUnited Arab EmiratesUnited KingdomUnited StatesUpper middle incomeUruguayUzbekistanVanuatuVenezuela, RBVietnamWest Bank and GazaWorldYemen, Rep.Zimbabwe Timeline:
This timeline shows a graph from 1972 to 2013 of Jordan. No data until 1971. Number of actual observations by date: 40.
Source name:
World Development Indicators
Source organization:
UNESCO Institute for Statistics
Categories, topics:
Education, Gender
Last updated:
apr 23, 2017
Indicators value changes by year
Minimum:
10.293
jan 1, 1979
Maximum:
36.063
jan 1, 2009
At the date of observation
Value
Absolute change
Change from previous value
jan 1, 1972
10.518
+10.518
0.0%
jan 1, 1973
12.587
+2.069
19.67%
jan 1, 1974
12.601
+0.014
0.11%
jan 1, 1975
12.311
-0.29
-2.3%
jan 1, 1976
12.682
+0.37
3.01%
jan 1, 1977
12.119
-0.563
-4.44%
jan 1, 1978
10.67
-1.448
-11.95%
jan 1, 1979
10.293
-0.377
-3.53%
jan 1, 1980
10.438
+0.145
1.4%
jan 1, 1981
11.087
+0.649
6.22%
jan 1, 1982
13.014
+1.927
17.38%
jan 1, 1983
13.554
+0.539
4.14%
jan 1, 1984
14.496
+0.942
6.95%
jan 1, 1985
15.37
+0.874
6.03%
jan 1, 1986
16.284
+0.914
5.95%
jan 1, 1987
16.489
+0.205
1.26%
jan 1, 1988
18.276
+1.787
10.84%
jan 1, 1989
18.286
+0.01
0.05%
jan 1, 1990
19.444
+1.158
6.33%
jan 1, 1991
20.633
+1.189
6.11%
jan 1, 1992
20.958
+0.325
1.57%
jan 1, 1993
22.973
+2.016
9.62%
jan 1, 1994
24.294
+1.321
5.75%
jan 1, 1995
25.973
+1.678
6.91%
jan 1, 1996
26.902
+0.93
3.58%
jan 1, 1997
28.64
+1.738
6.46%
jan 1, 1998
30.517
+1.877
6.55%
jan 1, 1999
29.471
-1.046
-3.43%
jan 1, 2000
30.64
+1.169
3.97%
jan 1, 2001
32.428
+1.788
5.84%
jan 1, 2003
34.15
+1.722
5.31%
jan 1, 2004
33.318
-0.832
-2.44%
jan 1, 2005
33.09
-0.227
-0.68%
jan 1, 2006
34.337
+1.247
3.77%
jan 1, 2007
34.71
+0.373
1.09%
jan 1, 2008
32.978
-1.732
-4.99%
jan 1, 2009
36.063
+3.085
9.36%
jan 1, 2011
31.83
-4.233
-11.74%
jan 1, 2012
31.949
+0.119
0.37%
jan 1, 2013
32.935
+0.986
3.08%
Ranking of countries by current statistics by years


Comments: