30
/
AIzaSyAYiBZKx7MnpbEhh9jyipgxe19OcubqV5w
April 1, 2024
182133
Luxembourg
LUX
true
2
1
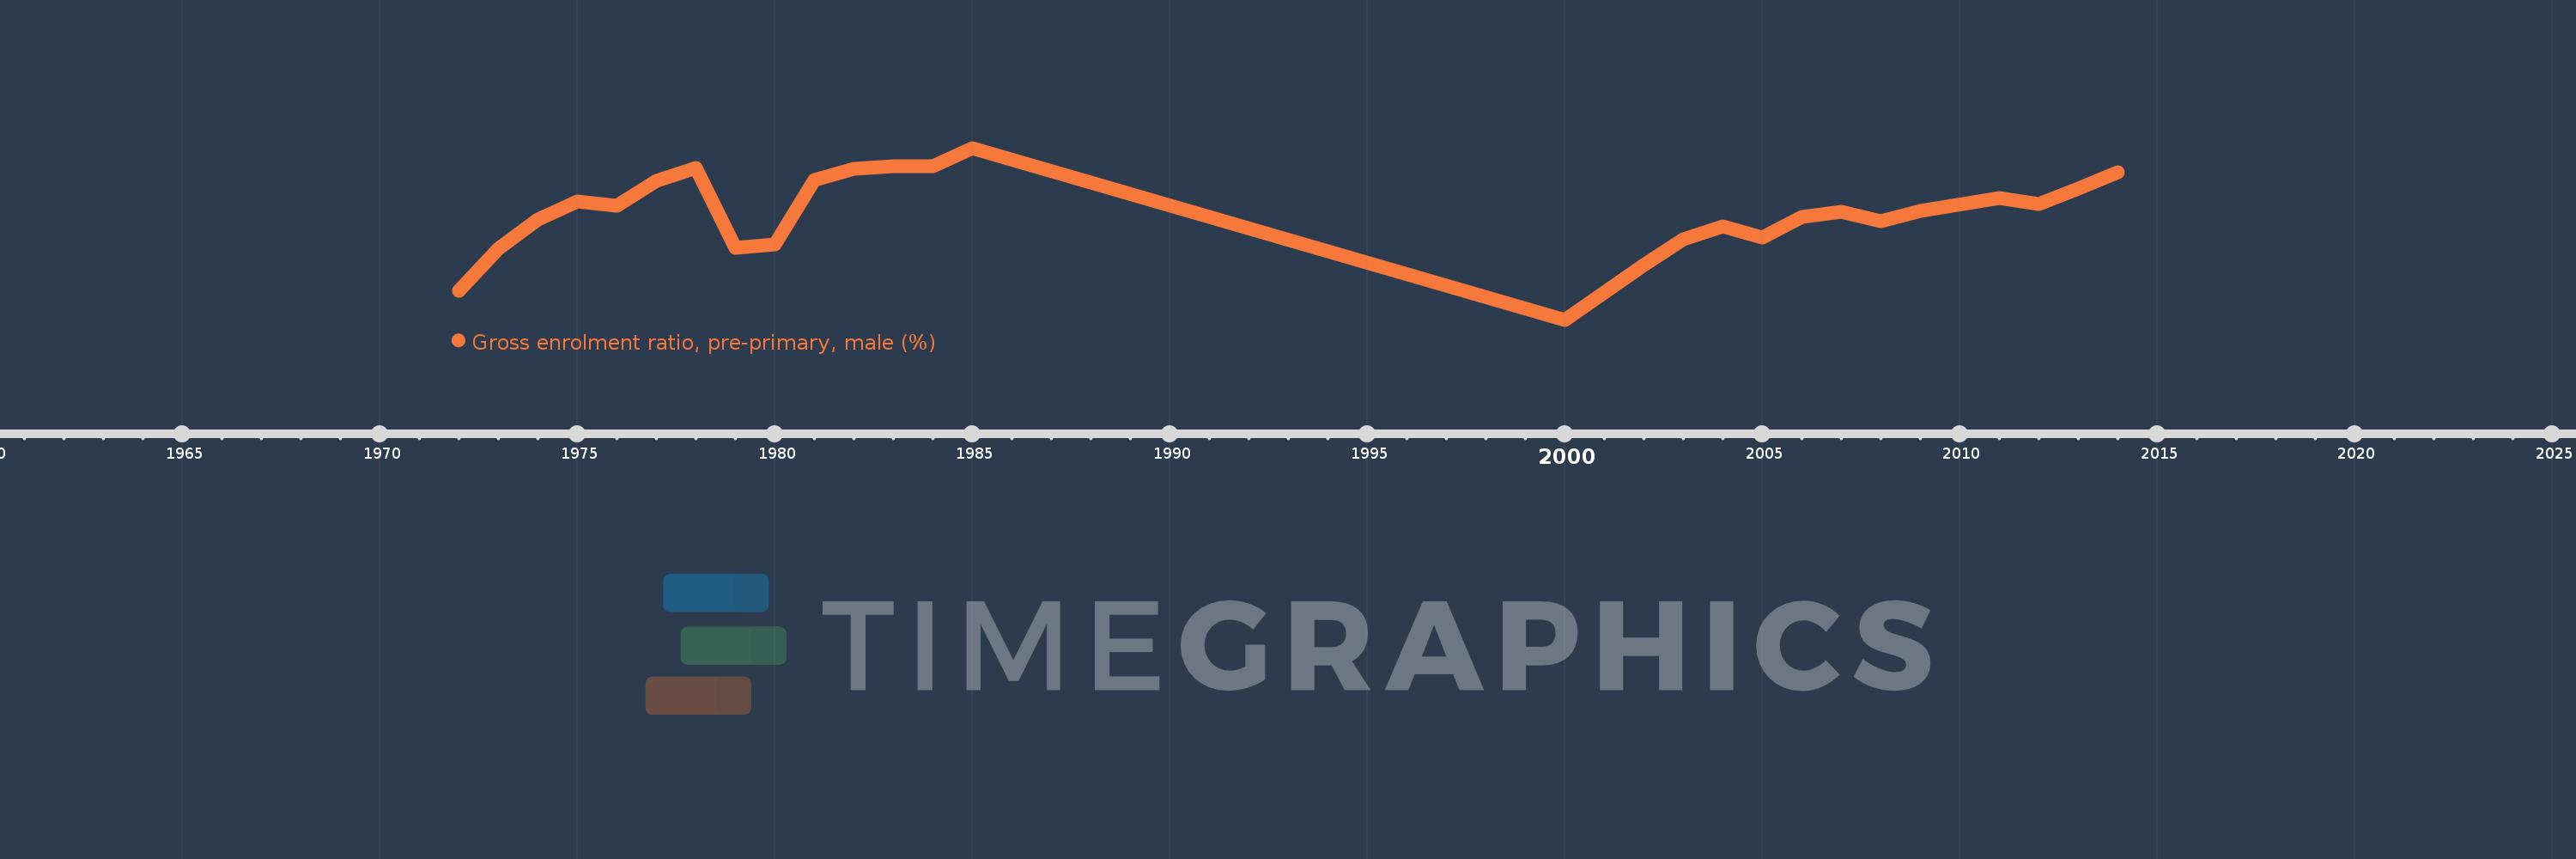
Gross enrolment ratio, pre-primary, male (%)
2014,2013,2012,2011,2009,2008,2007,2006,2005,2004,2003,2002,2000,1985,1984,1983,1982,1981,1980,1979,1978,1977,1976,1975,1974,1973,1972
