29
/
en
AIzaSyAYiBZKx7MnpbEhh9jyipgxe19OcubqV5w
April 1, 2024
26550
Early-demographic dividend
EAR
false
2
1
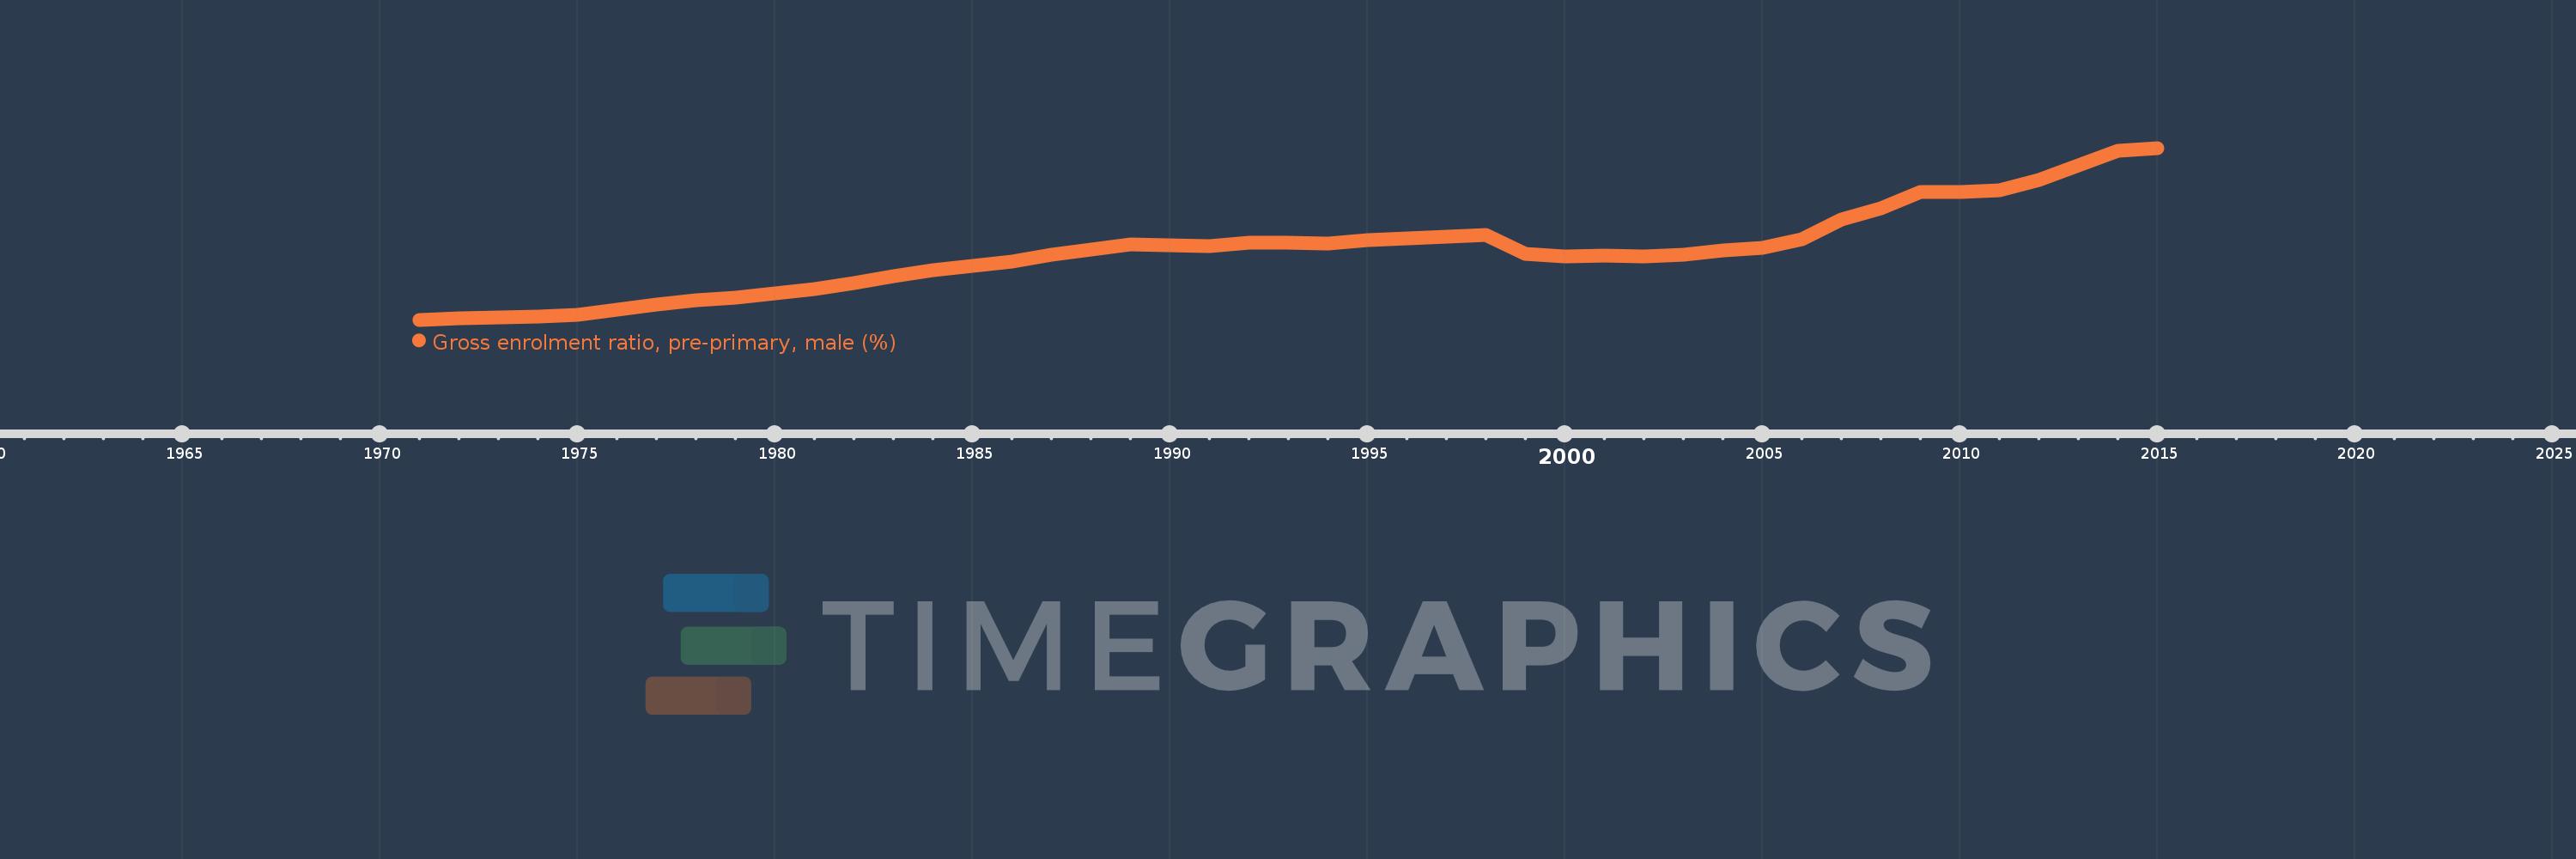
Gross enrolment ratio, pre-primary, male (%)
2015,2014,2013,2012,2011,2010,2009,2008,2007,2006,2005,2004,2003,2002,2001,2000,1999,1998,1997,1996,1995,1994,1993,1992,1991,1990,1989,1988,1987,1986,1985,1984,1983,1982,1981,1980,1979,1978,1977,1976,1975,1974,1973,1972,1971
This statistics in other country:
AfghanistanAlbaniaAlgeriaAndorraAngolaAntigua and BarbudaArab WorldArgentinaArmeniaArubaAustraliaAustriaAzerbaijanBahamas, TheBahrainBangladeshBarbadosBelarusBelgiumBelizeBeninBermudaBhutanBoliviaBosnia and HerzegovinaBotswanaBrazilBrunei DarussalamBulgariaBurkina FasoBurundiCabo VerdeCambodiaCameroonCanadaCaribbean small statesCentral African RepublicCentral Europe and the BalticsChadChileChinaColombiaComorosCongo, Dem. Rep.Congo, Rep.Costa RicaCote d'IvoireCroatiaCubaCyprusCzech RepublicDenmarkDjiboutiDominicaDominican RepublicEarly-demographic dividendEast Asia & PacificEast Asia & Pacific (excluding high income)East Asia & Pacific (IDA & IBRD countries)EcuadorEgypt, Arab Rep.El SalvadorEquatorial GuineaEritreaEstoniaEthiopiaEuro areaEurope & Central AsiaEurope & Central Asia (excluding high income)Europe & Central Asia (IDA & IBRD countries)European UnionFijiFinlandFragile and conflict affected situationsFranceGabonGambia, TheGeorgiaGermanyGhanaGreeceGrenadaGuatemalaGuineaGuinea-BissauGuyanaHeavily indebted poor countries (HIPC)High incomeHondurasHong Kong SAR, ChinaHungaryIBRD onlyIcelandIDA & IBRD totalIDA blendIDA onlyIDA totalIndiaIndonesiaIran, Islamic Rep.IraqIrelandIsraelItalyJamaicaJapanJordanKazakhstanKenyaKorea, Dem. People’s Rep.Korea, Rep.KuwaitKyrgyz RepublicLao PDRLate-demographic dividendLatin America & Caribbean Latin America & Caribbean (excluding high income)Latin America & the Caribbean (IDA & IBRD countries)LatviaLeast developed countries: UN classificationLebanonLesothoLiberiaLibyaLiechtensteinLithuaniaLow & middle incomeLow incomeLower middle incomeLuxembourgMacao SAR, ChinaMacedonia, FYRMadagascarMaldivesMaliMaltaMarshall IslandsMauritaniaMauritiusMexicoMicronesia, Fed. Sts.Middle East & North AfricaMiddle East & North Africa (excluding high income)Middle East & North Africa (IDA & IBRD countries)Middle incomeMoldovaMongoliaMontenegroMoroccoMozambiqueMyanmarNamibiaNauruNepalNetherlandsNew ZealandNicaraguaNigerNigeriaNorth AmericaNorwayOECD membersOmanOther small statesPacific island small statesPakistanPalauPanamaPapua New GuineaParaguayPeruPhilippinesPolandPortugalPost-demographic dividendPre-demographic dividendPuerto RicoQatarRomaniaRussian FederationRwandaSamoaSan MarinoSao Tome and PrincipeSaudi ArabiaSenegalSerbiaSeychellesSierra LeoneSlovak RepublicSloveniaSmall statesSolomon IslandsSomaliaSouth AfricaSouth AsiaSouth Asia (IDA & IBRD)South SudanSpainSri LankaSt. Kitts and NevisSt. LuciaSt. Vincent and the GrenadinesSub-Saharan Africa Sub-Saharan Africa (excluding high income)Sub-Saharan Africa (IDA & IBRD countries)SudanSurinameSwazilandSwedenSwitzerlandSyrian Arab RepublicTajikistanTanzaniaThailandTimor-LesteTogoTongaTrinidad and TobagoTunisiaTurkeyTurkmenistanTuvaluUgandaUkraineUnited Arab EmiratesUnited KingdomUnited StatesUpper middle incomeUruguayUzbekistanVanuatuVenezuela, RBVietnamWest Bank and GazaWorldYemen, Rep.Zimbabwe Timeline:
This timeline shows a graph from 1971 to 2015 of Early-demographic dividend. No data until 1970. Number of actual observations by date: 45.
Source name:
World Development Indicators
Source organization:
UNESCO Institute for Statistics
Categories, topics:
Education, Gender
Last updated:
apr 23, 2017
Indicators value changes by year
Maximum:
30.458
jan 1, 2015
At the date of observation
Value
Absolute change
Change from previous value
jan 1, 1971
8.621
+8.621
0.0%
jan 1, 1972
8.769
+0.148
1.72%
jan 1, 1973
8.905
+0.136
1.55%
jan 1, 1974
9.051
+0.146
1.64%
jan 1, 1975
9.294
+0.243
2.68%
jan 1, 1976
9.941
+0.647
6.96%
jan 1, 1977
10.522
+0.581
5.84%
jan 1, 1978
11.098
+0.576
5.47%
jan 1, 1979
11.473
+0.375
3.38%
jan 1, 1980
12.004
+0.531
4.63%
jan 1, 1981
12.564
+0.56
4.66%
jan 1, 1982
13.313
+0.749
5.96%
jan 1, 1983
14.122
+0.809
6.08%
jan 1, 1984
14.874
+0.752
5.33%
jan 1, 1985
15.508
+0.634
4.26%
jan 1, 1986
16.051
+0.543
3.5%
jan 1, 1987
16.908
+0.857
5.34%
jan 1, 1988
17.497
+0.589
3.49%
jan 1, 1989
18.201
+0.704
4.02%
jan 1, 1990
18.077
-0.124
-0.68%
jan 1, 1991
17.951
-0.126
-0.7%
jan 1, 1992
18.377
+0.426
2.37%
jan 1, 1993
18.365
-0.012
-0.06%
jan 1, 1994
18.326
-0.039
-0.21%
jan 1, 1995
18.734
+0.408
2.23%
jan 1, 1996
19.008
+0.273
1.46%
jan 1, 1997
19.169
+0.162
0.85%
jan 1, 1998
19.363
+0.193
1.01%
jan 1, 1999
17.007
-2.356
-12.17%
jan 1, 2000
16.703
-0.304
-1.79%
jan 1, 2001
16.811
+0.108
0.65%
jan 1, 2002
16.72
-0.091
-0.54%
jan 1, 2003
16.883
+0.163
0.98%
jan 1, 2004
17.467
+0.584
3.46%
jan 1, 2005
17.772
+0.305
1.75%
jan 1, 2006
18.878
+1.105
6.22%
jan 1, 2007
21.325
+2.447
12.96%
jan 1, 2008
22.826
+1.501
7.04%
jan 1, 2009
24.891
+2.066
9.05%
jan 1, 2010
24.909
+0.018
0.07%
jan 1, 2011
25.034
+0.125
0.5%
jan 1, 2012
26.357
+1.322
5.28%
jan 1, 2013
28.23
+1.873
7.11%
jan 1, 2014
30.107
+1.877
6.65%
jan 1, 2015
30.458
+0.351
1.16%
Ranking of countries by current statistics by years


Comments: