29
/
en
AIzaSyAYiBZKx7MnpbEhh9jyipgxe19OcubqV5w
April 1, 2024
94920
Burkina Faso
BFA
true
2
1
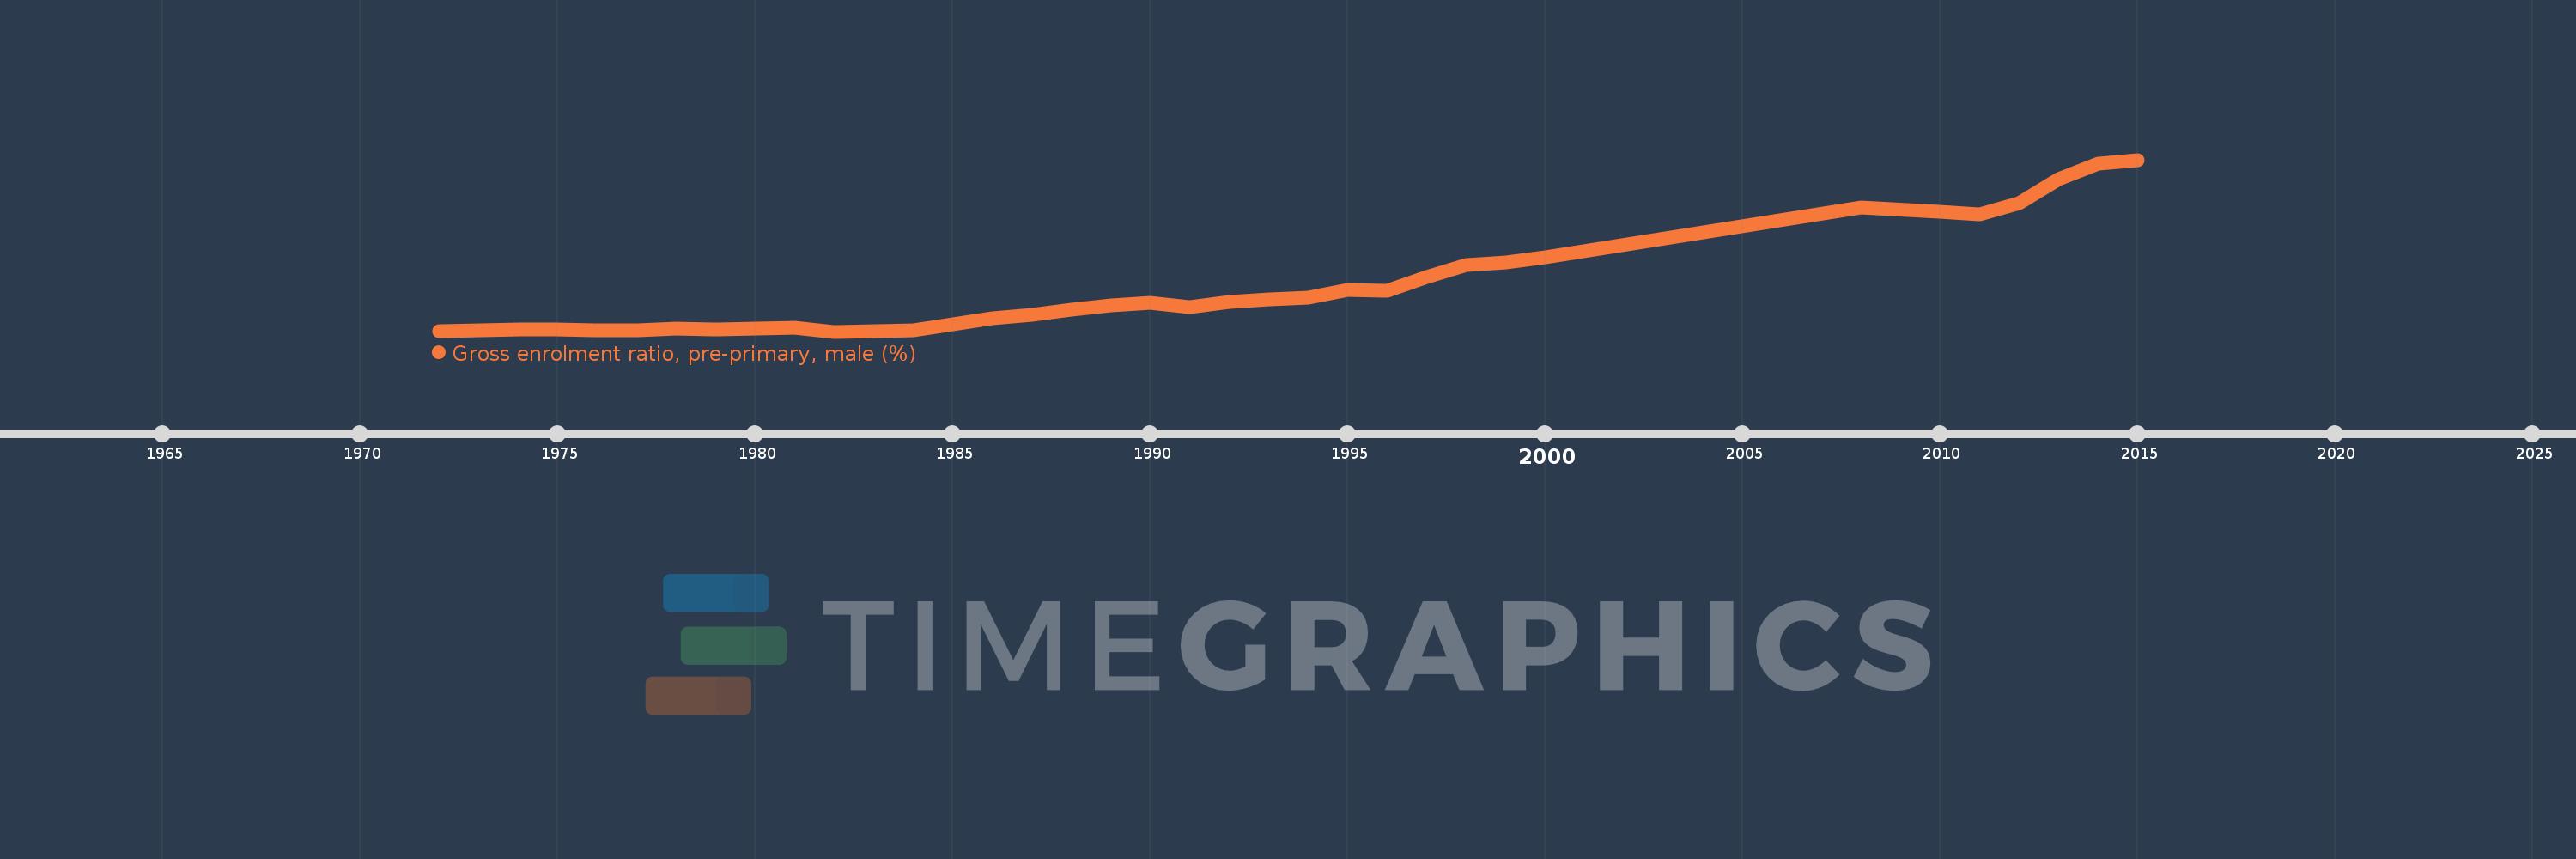
Gross enrolment ratio, pre-primary, male (%)
2015,2014,2013,2012,2011,2010,2008,2000,1999,1998,1997,1996,1995,1994,1993,1992,1991,1990,1989,1988,1987,1986,1985,1984,1983,1982,1981,1980,1979,1978,1977,1976,1975,1974,1973,1972
This statistics in other country:
AfghanistanAlbaniaAlgeriaAndorraAngolaAntigua and BarbudaArab WorldArgentinaArmeniaArubaAustraliaAustriaAzerbaijanBahamas, TheBahrainBangladeshBarbadosBelarusBelgiumBelizeBeninBermudaBhutanBoliviaBosnia and HerzegovinaBotswanaBrazilBrunei DarussalamBulgariaBurkina FasoBurundiCabo VerdeCambodiaCameroonCanadaCaribbean small statesCentral African RepublicCentral Europe and the BalticsChadChileChinaColombiaComorosCongo, Dem. Rep.Congo, Rep.Costa RicaCote d'IvoireCroatiaCubaCyprusCzech RepublicDenmarkDjiboutiDominicaDominican RepublicEarly-demographic dividendEast Asia & PacificEast Asia & Pacific (excluding high income)East Asia & Pacific (IDA & IBRD countries)EcuadorEgypt, Arab Rep.El SalvadorEquatorial GuineaEritreaEstoniaEthiopiaEuro areaEurope & Central AsiaEurope & Central Asia (excluding high income)Europe & Central Asia (IDA & IBRD countries)European UnionFijiFinlandFragile and conflict affected situationsFranceGabonGambia, TheGeorgiaGermanyGhanaGreeceGrenadaGuatemalaGuineaGuinea-BissauGuyanaHeavily indebted poor countries (HIPC)High incomeHondurasHong Kong SAR, ChinaHungaryIBRD onlyIcelandIDA & IBRD totalIDA blendIDA onlyIDA totalIndiaIndonesiaIran, Islamic Rep.IraqIrelandIsraelItalyJamaicaJapanJordanKazakhstanKenyaKorea, Dem. People’s Rep.Korea, Rep.KuwaitKyrgyz RepublicLao PDRLate-demographic dividendLatin America & Caribbean Latin America & Caribbean (excluding high income)Latin America & the Caribbean (IDA & IBRD countries)LatviaLeast developed countries: UN classificationLebanonLesothoLiberiaLibyaLiechtensteinLithuaniaLow & middle incomeLow incomeLower middle incomeLuxembourgMacao SAR, ChinaMacedonia, FYRMadagascarMaldivesMaliMaltaMarshall IslandsMauritaniaMauritiusMexicoMicronesia, Fed. Sts.Middle East & North AfricaMiddle East & North Africa (excluding high income)Middle East & North Africa (IDA & IBRD countries)Middle incomeMoldovaMongoliaMontenegroMoroccoMozambiqueMyanmarNamibiaNauruNepalNetherlandsNew ZealandNicaraguaNigerNigeriaNorth AmericaNorwayOECD membersOmanOther small statesPacific island small statesPakistanPalauPanamaPapua New GuineaParaguayPeruPhilippinesPolandPortugalPost-demographic dividendPre-demographic dividendPuerto RicoQatarRomaniaRussian FederationRwandaSamoaSan MarinoSao Tome and PrincipeSaudi ArabiaSenegalSerbiaSeychellesSierra LeoneSlovak RepublicSloveniaSmall statesSolomon IslandsSomaliaSouth AfricaSouth AsiaSouth Asia (IDA & IBRD)South SudanSpainSri LankaSt. Kitts and NevisSt. LuciaSt. Vincent and the GrenadinesSub-Saharan Africa Sub-Saharan Africa (excluding high income)Sub-Saharan Africa (IDA & IBRD countries)SudanSurinameSwazilandSwedenSwitzerlandSyrian Arab RepublicTajikistanTanzaniaThailandTimor-LesteTogoTongaTrinidad and TobagoTunisiaTurkeyTurkmenistanTuvaluUgandaUkraineUnited Arab EmiratesUnited KingdomUnited StatesUpper middle incomeUruguayUzbekistanVanuatuVenezuela, RBVietnamWest Bank and GazaWorldYemen, Rep.Zimbabwe Timeline:
This timeline shows a graph from 1972 to 2015 of Burkina Faso. No data until 1971. Number of actual observations by date: 36.
Source name:
World Development Indicators
Source organization:
UNESCO Institute for Statistics
Categories, topics:
Education, Gender
Last updated:
apr 23, 2017
Indicators value changes by year
At the date of observation
Value
Absolute change
Change from previous value
jan 1, 1972
0.073
+0.073
0.0%
jan 1, 1973
0.09
+0.017
23.04%
jan 1, 1974
0.119
+0.029
32.44%
jan 1, 1975
0.11
-0.009
-7.79%
jan 1, 1976
0.088
-0.021
-19.42%
jan 1, 1977
0.09
+0.001
1.44%
jan 1, 1978
0.126
+0.036
40.45%
jan 1, 1979
0.107
-0.019
-15.36%
jan 1, 1980
0.137
+0.031
28.72%
jan 1, 1981
0.147
+0.009
6.73%
jan 1, 1982
0.062
-0.084
-57.38%
jan 1, 1983
0.082
+0.019
30.76%
jan 1, 1984
0.099
+0.018
21.76%
jan 1, 1985
0.231
+0.131
132.01%
jan 1, 1986
0.376
+0.145
62.78%
jan 1, 1987
0.457
+0.081
21.7%
jan 1, 1988
0.585
+0.128
27.9%
jan 1, 1989
0.679
+0.094
16.14%
jan 1, 1990
0.741
+0.062
9.12%
jan 1, 1991
0.631
-0.109
-14.77%
jan 1, 1992
0.759
+0.128
20.23%
jan 1, 1993
0.825
+0.066
8.64%
jan 1, 1994
0.856
+0.031
3.82%
jan 1, 1995
1.036
+0.179
20.95%
jan 1, 1996
1.018
-0.017
-1.68%
jan 1, 1997
1.343
+0.325
31.93%
jan 1, 1998
1.617
+0.273
20.35%
jan 1, 1999
1.676
+0.059
3.65%
jan 1, 2000
1.811
+0.135
8.09%
jan 1, 2008
2.983
+1.172
64.69%
jan 1, 2010
2.88
-0.103
-3.44%
jan 1, 2011
2.821
-0.059
-2.05%
jan 1, 2012
3.082
+0.261
9.25%
jan 1, 2013
3.635
+0.553
17.96%
jan 1, 2014
4.003
+0.367
10.11%
jan 1, 2015
4.093
+0.09
2.25%
Ranking of countries by current statistics by years


Comments: