29
/
en
AIzaSyAYiBZKx7MnpbEhh9jyipgxe19OcubqV5w
April 1, 2024
195606
Mexico
MEX
true
2
1
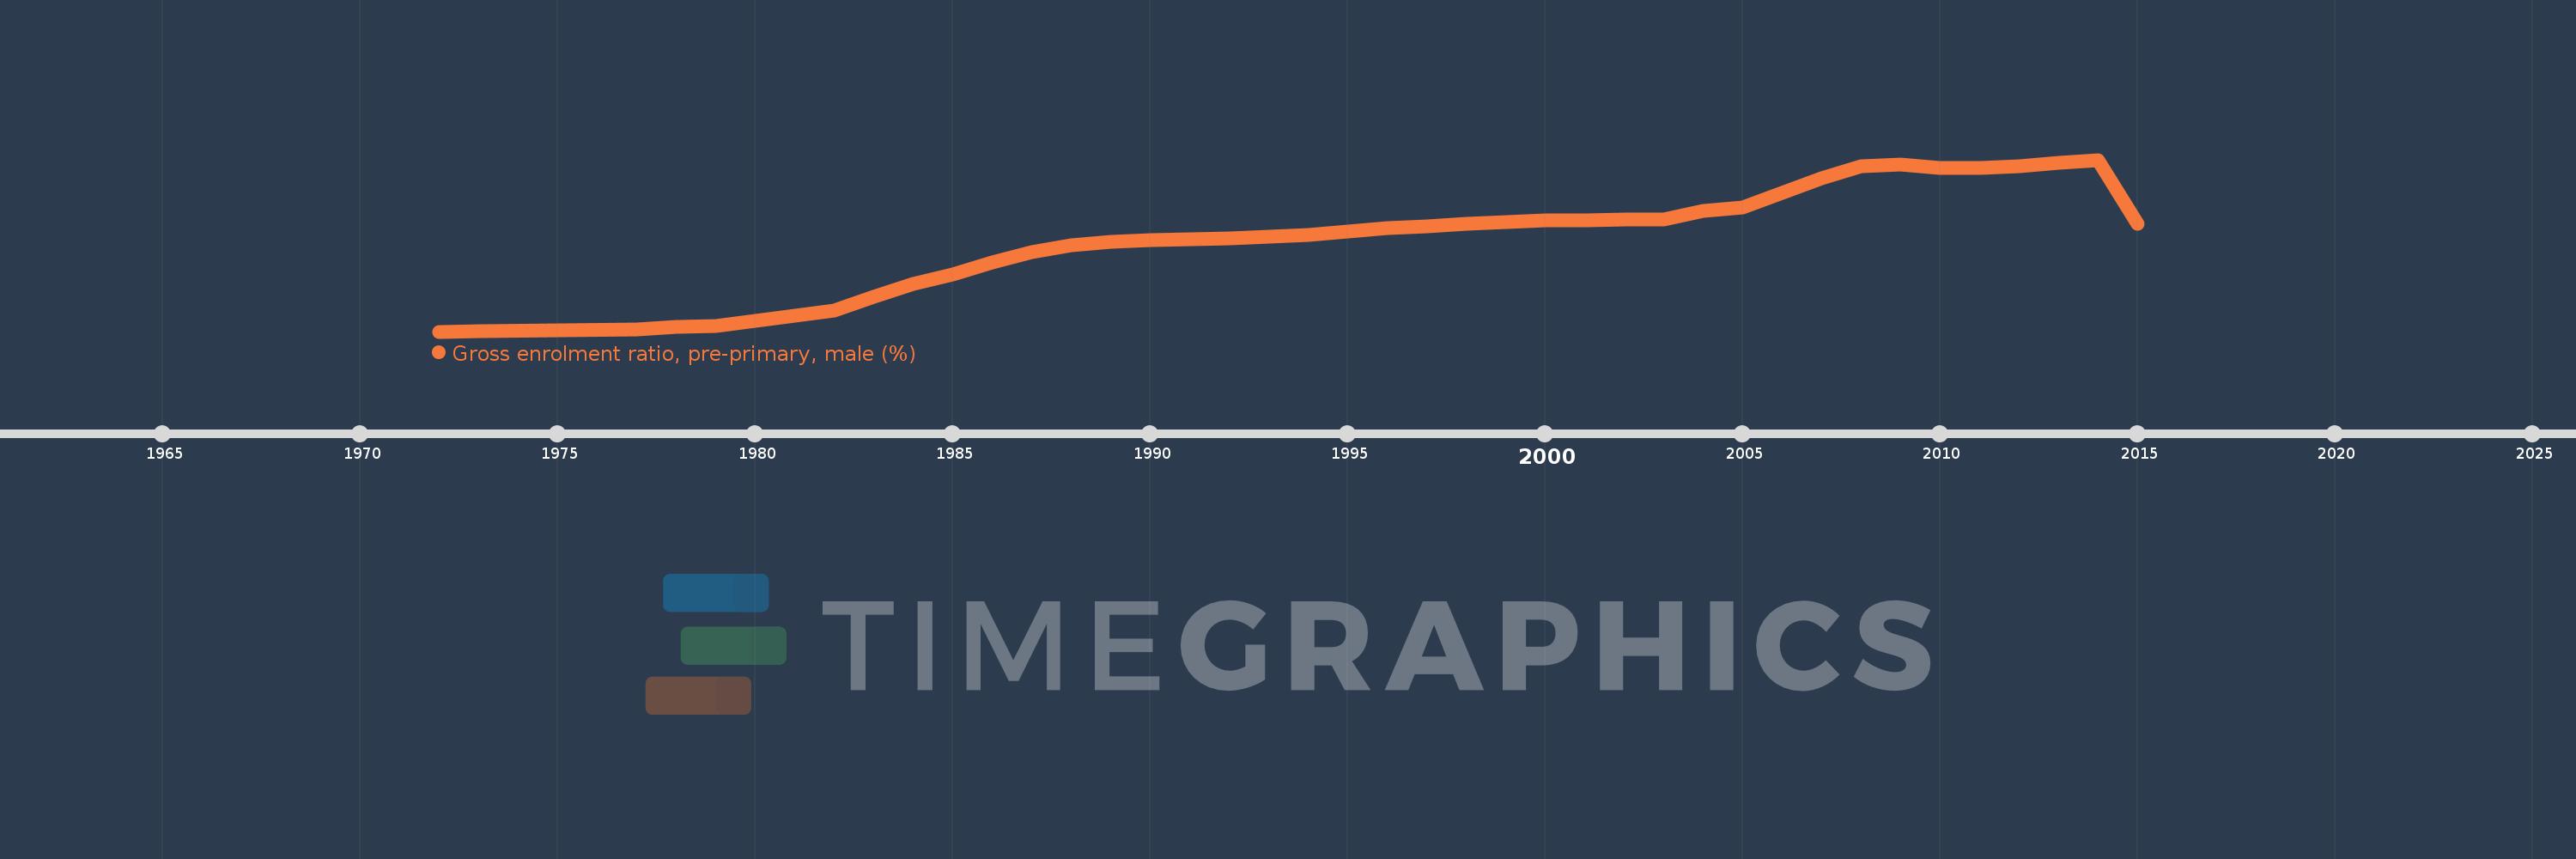
Gross enrolment ratio, pre-primary, male (%)
2015,2014,2013,2012,2011,2010,2009,2008,2007,2006,2005,2004,2003,2002,2001,2000,1999,1998,1997,1996,1995,1994,1993,1992,1991,1990,1989,1988,1987,1986,1985,1984,1983,1982,1979,1978,1977,1973,1972
This statistics in other country:
AfghanistanAlbaniaAlgeriaAndorraAngolaAntigua and BarbudaArab WorldArgentinaArmeniaArubaAustraliaAustriaAzerbaijanBahamas, TheBahrainBangladeshBarbadosBelarusBelgiumBelizeBeninBermudaBhutanBoliviaBosnia and HerzegovinaBotswanaBrazilBrunei DarussalamBulgariaBurkina FasoBurundiCabo VerdeCambodiaCameroonCanadaCaribbean small statesCentral African RepublicCentral Europe and the BalticsChadChileChinaColombiaComorosCongo, Dem. Rep.Congo, Rep.Costa RicaCote d'IvoireCroatiaCubaCyprusCzech RepublicDenmarkDjiboutiDominicaDominican RepublicEarly-demographic dividendEast Asia & PacificEast Asia & Pacific (excluding high income)East Asia & Pacific (IDA & IBRD countries)EcuadorEgypt, Arab Rep.El SalvadorEquatorial GuineaEritreaEstoniaEthiopiaEuro areaEurope & Central AsiaEurope & Central Asia (excluding high income)Europe & Central Asia (IDA & IBRD countries)European UnionFijiFinlandFragile and conflict affected situationsFranceGabonGambia, TheGeorgiaGermanyGhanaGreeceGrenadaGuatemalaGuineaGuinea-BissauGuyanaHeavily indebted poor countries (HIPC)High incomeHondurasHong Kong SAR, ChinaHungaryIBRD onlyIcelandIDA & IBRD totalIDA blendIDA onlyIDA totalIndiaIndonesiaIran, Islamic Rep.IraqIrelandIsraelItalyJamaicaJapanJordanKazakhstanKenyaKorea, Dem. People’s Rep.Korea, Rep.KuwaitKyrgyz RepublicLao PDRLate-demographic dividendLatin America & Caribbean Latin America & Caribbean (excluding high income)Latin America & the Caribbean (IDA & IBRD countries)LatviaLeast developed countries: UN classificationLebanonLesothoLiberiaLibyaLiechtensteinLithuaniaLow & middle incomeLow incomeLower middle incomeLuxembourgMacao SAR, ChinaMacedonia, FYRMadagascarMaldivesMaliMaltaMarshall IslandsMauritaniaMauritiusMexicoMicronesia, Fed. Sts.Middle East & North AfricaMiddle East & North Africa (excluding high income)Middle East & North Africa (IDA & IBRD countries)Middle incomeMoldovaMongoliaMontenegroMoroccoMozambiqueMyanmarNamibiaNauruNepalNetherlandsNew ZealandNicaraguaNigerNigeriaNorth AmericaNorwayOECD membersOmanOther small statesPacific island small statesPakistanPalauPanamaPapua New GuineaParaguayPeruPhilippinesPolandPortugalPost-demographic dividendPre-demographic dividendPuerto RicoQatarRomaniaRussian FederationRwandaSamoaSan MarinoSao Tome and PrincipeSaudi ArabiaSenegalSerbiaSeychellesSierra LeoneSlovak RepublicSloveniaSmall statesSolomon IslandsSomaliaSouth AfricaSouth AsiaSouth Asia (IDA & IBRD)South SudanSpainSri LankaSt. Kitts and NevisSt. LuciaSt. Vincent and the GrenadinesSub-Saharan Africa Sub-Saharan Africa (excluding high income)Sub-Saharan Africa (IDA & IBRD countries)SudanSurinameSwazilandSwedenSwitzerlandSyrian Arab RepublicTajikistanTanzaniaThailandTimor-LesteTogoTongaTrinidad and TobagoTunisiaTurkeyTurkmenistanTuvaluUgandaUkraineUnited Arab EmiratesUnited KingdomUnited StatesUpper middle incomeUruguayUzbekistanVanuatuVenezuela, RBVietnamWest Bank and GazaWorldYemen, Rep.Zimbabwe Timeline:
This timeline shows a graph from 1972 to 2015 of Mexico. No data until 1971. Number of actual observations by date: 39.
Source name:
World Development Indicators
Source organization:
UNESCO Institute for Statistics
Categories, topics:
Education, Gender
Last updated:
apr 23, 2017
Indicators value changes by year
Maximum:
101.285
jan 1, 2014
At the date of observation
Value
Absolute change
Change from previous value
jan 1, 1972
11.98
+11.98
0.0%
jan 1, 1973
12.149
+0.169
1.41%
jan 1, 1977
13.189
+1.04
8.56%
jan 1, 1978
14.653
+1.464
11.1%
jan 1, 1979
14.776
+0.123
0.84%
jan 1, 1982
22.805
+8.03
54.34%
jan 1, 1983
30.064
+7.259
31.83%
jan 1, 1984
36.625
+6.562
21.83%
jan 1, 1985
41.731
+5.106
13.94%
jan 1, 1986
48.067
+6.336
15.18%
jan 1, 1987
53.26
+5.192
10.8%
jan 1, 1988
57.062
+3.802
7.14%
jan 1, 1989
58.703
+1.642
2.88%
jan 1, 1990
59.388
+0.684
1.17%
jan 1, 1991
59.966
+0.578
0.97%
jan 1, 1992
60.432
+0.466
0.78%
jan 1, 1993
61.148
+0.716
1.18%
jan 1, 1994
62.043
+0.895
1.46%
jan 1, 1995
63.809
+1.766
2.85%
jan 1, 1996
65.585
+1.776
2.78%
jan 1, 1997
66.854
+1.268
1.93%
jan 1, 1998
67.857
+1.003
1.5%
jan 1, 1999
68.862
+1.006
1.48%
jan 1, 2000
69.632
+0.769
1.12%
jan 1, 2001
70.0
+0.368
0.53%
jan 1, 2002
70.412
+0.412
0.59%
jan 1, 2003
70.394
-0.017
-0.02%
jan 1, 2004
74.522
+4.128
5.86%
jan 1, 2005
76.547
+2.025
2.72%
jan 1, 2006
83.977
+7.43
9.71%
jan 1, 2007
91.582
+7.604
9.06%
jan 1, 2008
97.957
+6.376
6.96%
jan 1, 2009
98.633
+0.676
0.69%
jan 1, 2010
96.972
-1.661
-1.68%
jan 1, 2011
96.988
+0.016
0.02%
jan 1, 2012
98.044
+1.056
1.09%
jan 1, 2013
99.762
+1.718
1.75%
jan 1, 2014
101.285
+1.523
1.53%
jan 1, 2015
68.177
-33.108
-32.69%
Ranking of countries by current statistics by years


Comments: