29
/
en
AIzaSyAYiBZKx7MnpbEhh9jyipgxe19OcubqV5w
April 1, 2024
154656
India
IND
true
2
1
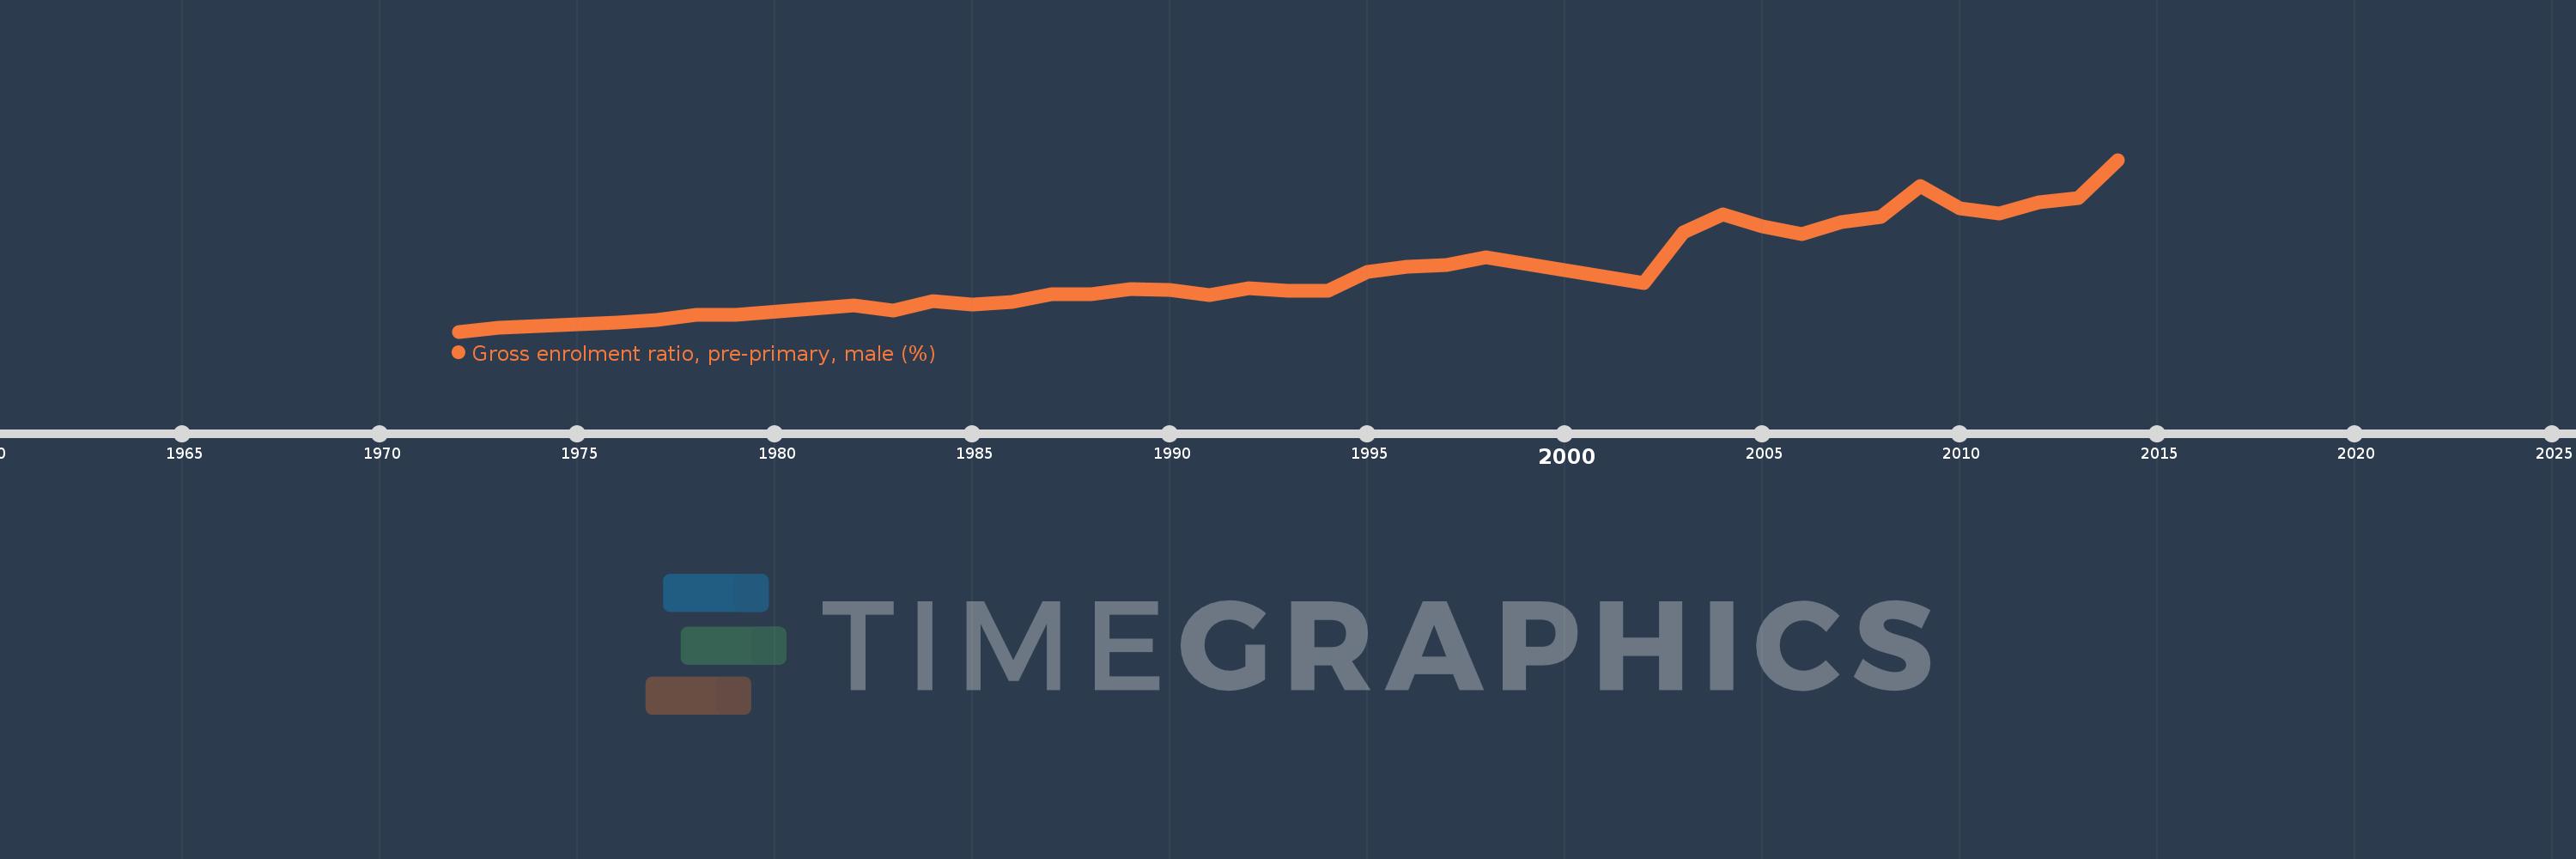
Gross enrolment ratio, pre-primary, male (%)
2014,2013,2012,2011,2010,2009,2008,2007,2006,2005,2004,2003,2002,1998,1997,1996,1995,1994,1993,1992,1991,1990,1989,1988,1987,1986,1985,1984,1983,1982,1979,1978,1977,1976,1974,1973,1972
This statistics in other country:
AfghanistanAlbaniaAlgeriaAndorraAngolaAntigua and BarbudaArab WorldArgentinaArmeniaArubaAustraliaAustriaAzerbaijanBahamas, TheBahrainBangladeshBarbadosBelarusBelgiumBelizeBeninBermudaBhutanBoliviaBosnia and HerzegovinaBotswanaBrazilBrunei DarussalamBulgariaBurkina FasoBurundiCabo VerdeCambodiaCameroonCanadaCaribbean small statesCentral African RepublicCentral Europe and the BalticsChadChileChinaColombiaComorosCongo, Dem. Rep.Congo, Rep.Costa RicaCote d'IvoireCroatiaCubaCyprusCzech RepublicDenmarkDjiboutiDominicaDominican RepublicEarly-demographic dividendEast Asia & PacificEast Asia & Pacific (excluding high income)East Asia & Pacific (IDA & IBRD countries)EcuadorEgypt, Arab Rep.El SalvadorEquatorial GuineaEritreaEstoniaEthiopiaEuro areaEurope & Central AsiaEurope & Central Asia (excluding high income)Europe & Central Asia (IDA & IBRD countries)European UnionFijiFinlandFragile and conflict affected situationsFranceGabonGambia, TheGeorgiaGermanyGhanaGreeceGrenadaGuatemalaGuineaGuinea-BissauGuyanaHeavily indebted poor countries (HIPC)High incomeHondurasHong Kong SAR, ChinaHungaryIBRD onlyIcelandIDA & IBRD totalIDA blendIDA onlyIDA totalIndiaIndonesiaIran, Islamic Rep.IraqIrelandIsraelItalyJamaicaJapanJordanKazakhstanKenyaKorea, Dem. People’s Rep.Korea, Rep.KuwaitKyrgyz RepublicLao PDRLate-demographic dividendLatin America & Caribbean Latin America & Caribbean (excluding high income)Latin America & the Caribbean (IDA & IBRD countries)LatviaLeast developed countries: UN classificationLebanonLesothoLiberiaLibyaLiechtensteinLithuaniaLow & middle incomeLow incomeLower middle incomeLuxembourgMacao SAR, ChinaMacedonia, FYRMadagascarMaldivesMaliMaltaMarshall IslandsMauritaniaMauritiusMexicoMicronesia, Fed. Sts.Middle East & North AfricaMiddle East & North Africa (excluding high income)Middle East & North Africa (IDA & IBRD countries)Middle incomeMoldovaMongoliaMontenegroMoroccoMozambiqueMyanmarNamibiaNauruNepalNetherlandsNew ZealandNicaraguaNigerNigeriaNorth AmericaNorwayOECD membersOmanOther small statesPacific island small statesPakistanPalauPanamaPapua New GuineaParaguayPeruPhilippinesPolandPortugalPost-demographic dividendPre-demographic dividendPuerto RicoQatarRomaniaRussian FederationRwandaSamoaSan MarinoSao Tome and PrincipeSaudi ArabiaSenegalSerbiaSeychellesSierra LeoneSlovak RepublicSloveniaSmall statesSolomon IslandsSomaliaSouth AfricaSouth AsiaSouth Asia (IDA & IBRD)South SudanSpainSri LankaSt. Kitts and NevisSt. LuciaSt. Vincent and the GrenadinesSub-Saharan Africa Sub-Saharan Africa (excluding high income)Sub-Saharan Africa (IDA & IBRD countries)SudanSurinameSwazilandSwedenSwitzerlandSyrian Arab RepublicTajikistanTanzaniaThailandTimor-LesteTogoTongaTrinidad and TobagoTunisiaTurkeyTurkmenistanTuvaluUgandaUkraineUnited Arab EmiratesUnited KingdomUnited StatesUpper middle incomeUruguayUzbekistanVanuatuVenezuela, RBVietnamWest Bank and GazaWorldYemen, Rep.Zimbabwe Timeline:
This timeline shows a graph from 1972 to 2014 of India. No data until 1971. Number of actual observations by date: 37.
Source name:
World Development Indicators
Source organization:
UNESCO Institute for Statistics
Categories, topics:
Education, Gender
Last updated:
apr 23, 2017
Indicators value changes by year
Maximum:
10.003
jan 1, 2014
At the date of observation
Value
Absolute change
Change from previous value
jan 1, 1972
1.157
+1.157
0.0%
jan 1, 1973
1.359
+0.202
17.46%
jan 1, 1974
1.449
+0.09
6.65%
jan 1, 1976
1.625
+0.176
12.14%
jan 1, 1977
1.745
+0.12
7.35%
jan 1, 1978
2.015
+0.27
15.49%
jan 1, 1979
2.024
+0.01
0.48%
jan 1, 1982
2.526
+0.502
24.79%
jan 1, 1983
2.245
-0.281
-11.12%
jan 1, 1984
2.723
+0.477
21.27%
jan 1, 1985
2.569
-0.153
-5.63%
jan 1, 1986
2.679
+0.11
4.27%
jan 1, 1987
3.09
+0.411
15.32%
jan 1, 1988
3.102
+0.013
0.41%
jan 1, 1989
3.359
+0.257
8.27%
jan 1, 1990
3.293
-0.066
-1.96%
jan 1, 1991
3.05
-0.243
-7.38%
jan 1, 1992
3.393
+0.343
11.24%
jan 1, 1993
3.244
-0.148
-4.37%
jan 1, 1994
3.276
+0.032
0.97%
jan 1, 1995
4.244
+0.968
29.55%
jan 1, 1996
4.508
+0.264
6.21%
jan 1, 1997
4.59
+0.082
1.82%
jan 1, 1998
4.981
+0.391
8.52%
jan 1, 2002
3.667
-1.314
-26.38%
jan 1, 2003
6.261
+2.594
70.75%
jan 1, 2004
7.174
+0.913
14.58%
jan 1, 2005
6.585
-0.589
-8.21%
jan 1, 2006
6.188
-0.397
-6.03%
jan 1, 2007
6.817
+0.629
10.16%
jan 1, 2008
7.054
+0.237
3.47%
jan 1, 2009
8.632
+1.578
22.37%
jan 1, 2010
7.507
-1.125
-13.03%
jan 1, 2011
7.223
-0.284
-3.78%
jan 1, 2012
7.821
+0.598
8.27%
jan 1, 2013
8.046
+0.225
2.87%
jan 1, 2014
10.003
+1.958
24.33%
Ranking of countries by current statistics by years


Comments: