29
/
en
AIzaSyAYiBZKx7MnpbEhh9jyipgxe19OcubqV5w
April 1, 2024
34255
Fragile and conflict affected situations
FCS
false
2
1
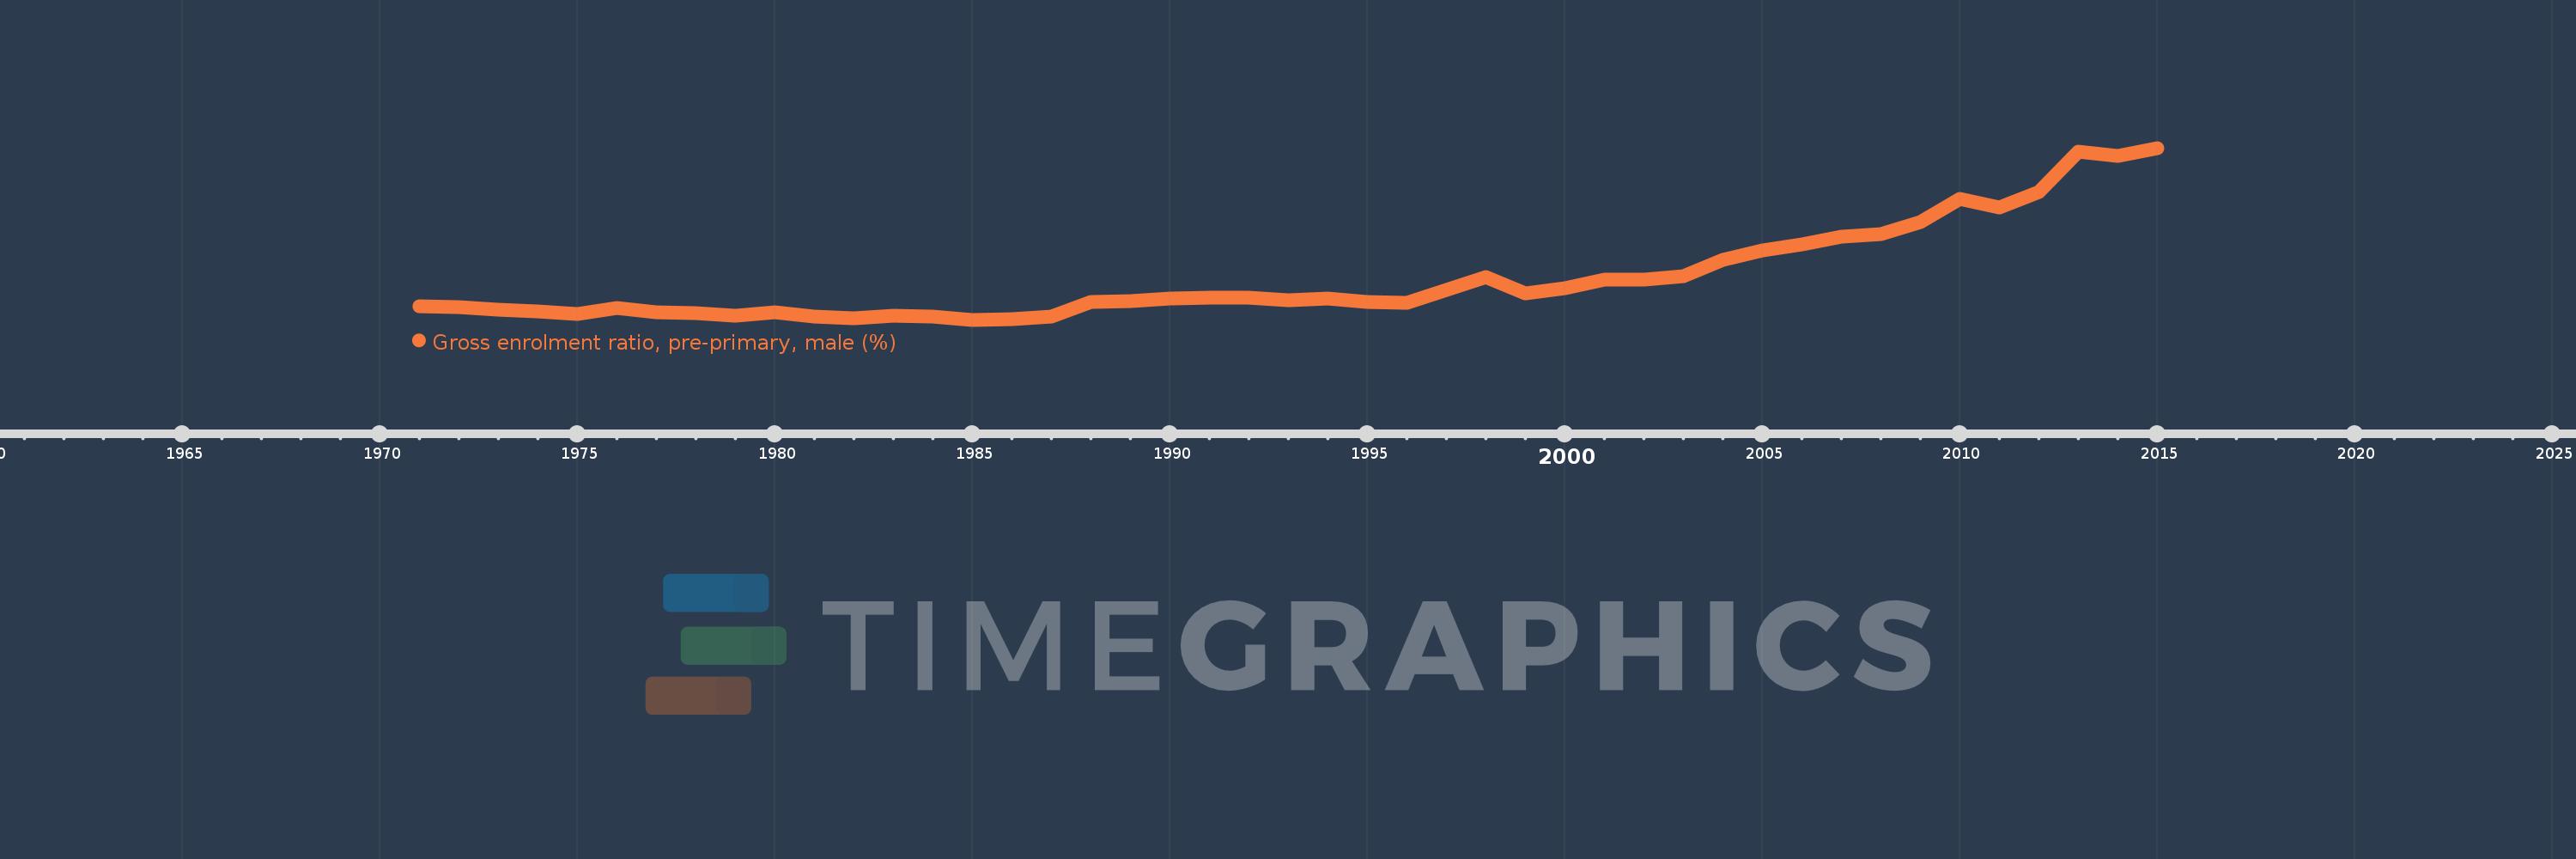
Gross enrolment ratio, pre-primary, male (%)
2015,2014,2013,2012,2011,2010,2009,2008,2007,2006,2005,2004,2003,2002,2001,2000,1999,1998,1997,1996,1995,1994,1993,1992,1991,1990,1989,1988,1987,1986,1985,1984,1983,1982,1981,1980,1979,1978,1977,1976,1975,1974,1973,1972,1971
This statistics in other country:
AfghanistanAlbaniaAlgeriaAndorraAngolaAntigua and BarbudaArab WorldArgentinaArmeniaArubaAustraliaAustriaAzerbaijanBahamas, TheBahrainBangladeshBarbadosBelarusBelgiumBelizeBeninBermudaBhutanBoliviaBosnia and HerzegovinaBotswanaBrazilBrunei DarussalamBulgariaBurkina FasoBurundiCabo VerdeCambodiaCameroonCanadaCaribbean small statesCentral African RepublicCentral Europe and the BalticsChadChileChinaColombiaComorosCongo, Dem. Rep.Congo, Rep.Costa RicaCote d'IvoireCroatiaCubaCyprusCzech RepublicDenmarkDjiboutiDominicaDominican RepublicEarly-demographic dividendEast Asia & PacificEast Asia & Pacific (excluding high income)East Asia & Pacific (IDA & IBRD countries)EcuadorEgypt, Arab Rep.El SalvadorEquatorial GuineaEritreaEstoniaEthiopiaEuro areaEurope & Central AsiaEurope & Central Asia (excluding high income)Europe & Central Asia (IDA & IBRD countries)European UnionFijiFinlandFragile and conflict affected situationsFranceGabonGambia, TheGeorgiaGermanyGhanaGreeceGrenadaGuatemalaGuineaGuinea-BissauGuyanaHeavily indebted poor countries (HIPC)High incomeHondurasHong Kong SAR, ChinaHungaryIBRD onlyIcelandIDA & IBRD totalIDA blendIDA onlyIDA totalIndiaIndonesiaIran, Islamic Rep.IraqIrelandIsraelItalyJamaicaJapanJordanKazakhstanKenyaKorea, Dem. People’s Rep.Korea, Rep.KuwaitKyrgyz RepublicLao PDRLate-demographic dividendLatin America & Caribbean Latin America & Caribbean (excluding high income)Latin America & the Caribbean (IDA & IBRD countries)LatviaLeast developed countries: UN classificationLebanonLesothoLiberiaLibyaLiechtensteinLithuaniaLow & middle incomeLow incomeLower middle incomeLuxembourgMacao SAR, ChinaMacedonia, FYRMadagascarMaldivesMaliMaltaMarshall IslandsMauritaniaMauritiusMexicoMicronesia, Fed. Sts.Middle East & North AfricaMiddle East & North Africa (excluding high income)Middle East & North Africa (IDA & IBRD countries)Middle incomeMoldovaMongoliaMontenegroMoroccoMozambiqueMyanmarNamibiaNauruNepalNetherlandsNew ZealandNicaraguaNigerNigeriaNorth AmericaNorwayOECD membersOmanOther small statesPacific island small statesPakistanPalauPanamaPapua New GuineaParaguayPeruPhilippinesPolandPortugalPost-demographic dividendPre-demographic dividendPuerto RicoQatarRomaniaRussian FederationRwandaSamoaSan MarinoSao Tome and PrincipeSaudi ArabiaSenegalSerbiaSeychellesSierra LeoneSlovak RepublicSloveniaSmall statesSolomon IslandsSomaliaSouth AfricaSouth AsiaSouth Asia (IDA & IBRD)South SudanSpainSri LankaSt. Kitts and NevisSt. LuciaSt. Vincent and the GrenadinesSub-Saharan Africa Sub-Saharan Africa (excluding high income)Sub-Saharan Africa (IDA & IBRD countries)SudanSurinameSwazilandSwedenSwitzerlandSyrian Arab RepublicTajikistanTanzaniaThailandTimor-LesteTogoTongaTrinidad and TobagoTunisiaTurkeyTurkmenistanTuvaluUgandaUkraineUnited Arab EmiratesUnited KingdomUnited StatesUpper middle incomeUruguayUzbekistanVanuatuVenezuela, RBVietnamWest Bank and GazaWorldYemen, Rep.Zimbabwe Timeline:
This timeline shows a graph from 1971 to 2015 of Fragile and conflict affected situations. No data until 1970. Number of actual observations by date: 45.
Source name:
World Development Indicators
Source organization:
UNESCO Institute for Statistics
Categories, topics:
Education, Gender
Last updated:
apr 23, 2017
Indicators value changes by year
Maximum:
13.169
jan 1, 2015
At the date of observation
Value
Absolute change
Change from previous value
jan 1, 1971
6.858
+6.858
0.0%
jan 1, 1972
6.816
-0.042
-0.61%
jan 1, 1973
6.725
-0.091
-1.34%
jan 1, 1974
6.65
-0.075
-1.11%
jan 1, 1975
6.555
-0.095
-1.43%
jan 1, 1976
6.797
+0.242
3.69%
jan 1, 1977
6.636
-0.161
-2.37%
jan 1, 1978
6.59
-0.046
-0.69%
jan 1, 1979
6.473
-0.117
-1.78%
jan 1, 1980
6.61
+0.137
2.12%
jan 1, 1981
6.441
-0.17
-2.57%
jan 1, 1982
6.369
-0.072
-1.12%
jan 1, 1983
6.49
+0.121
1.9%
jan 1, 1984
6.436
-0.054
-0.83%
jan 1, 1985
6.321
-0.115
-1.79%
jan 1, 1986
6.342
+0.021
0.34%
jan 1, 1987
6.448
+0.106
1.67%
jan 1, 1988
7.038
+0.59
9.15%
jan 1, 1989
7.081
+0.043
0.61%
jan 1, 1990
7.156
+0.074
1.05%
jan 1, 1991
7.209
+0.053
0.75%
jan 1, 1992
7.19
-0.019
-0.26%
jan 1, 1993
7.102
-0.088
-1.22%
jan 1, 1994
7.177
+0.074
1.05%
jan 1, 1995
7.024
-0.153
-2.13%
jan 1, 1996
6.999
-0.025
-0.35%
jan 1, 1997
7.495
+0.496
7.08%
jan 1, 1998
8.008
+0.513
6.85%
jan 1, 1999
7.377
-0.631
-7.88%
jan 1, 2000
7.584
+0.207
2.8%
jan 1, 2001
7.905
+0.322
4.24%
jan 1, 2002
7.928
+0.023
0.29%
jan 1, 2003
8.055
+0.127
1.61%
jan 1, 2004
8.718
+0.663
8.23%
jan 1, 2005
9.069
+0.351
4.03%
jan 1, 2006
9.325
+0.256
2.82%
jan 1, 2007
9.64
+0.315
3.37%
jan 1, 2008
9.739
+0.1
1.03%
jan 1, 2009
10.197
+0.457
4.69%
jan 1, 2010
11.129
+0.932
9.14%
jan 1, 2011
10.784
-0.345
-3.1%
jan 1, 2012
11.415
+0.631
5.85%
jan 1, 2013
13.013
+1.597
13.99%
jan 1, 2014
12.847
-0.166
-1.27%
jan 1, 2015
13.169
+0.322
2.51%
Ranking of countries by current statistics by years


Comments: